Introducing Telmai data observability platform
Telmai, a versatile data monitoring tool, can track data in real-time, regardless of its location or whether it’s batch or streaming. Its engine, designed for extensive parallel data processing, efficiently analyzes hundreds of sources and thousands of attributes without overloading your critical infrastructure. This ensures immediate alerts and optimal performance.


Telmai can monitor data anywhere, not only after it lands in a data warehouse. And it is not limited to batch only but also works for streaming data. So you can get alerted right away. Telmai’s engine is designed to support massive parallelism in data processing and won’t unnecessarily load your critical infrastructure (e.g., data warehouse or operational database) while analyzing hundreds of sources and thousands of attributes.
Telmai doesn’t require any prior setup or configuration. Connect to your source and start monitoring right away. With Telmai, you can connect to files in cloud storage, data warehouses, operational databases, or even message buses to observe streams of data.
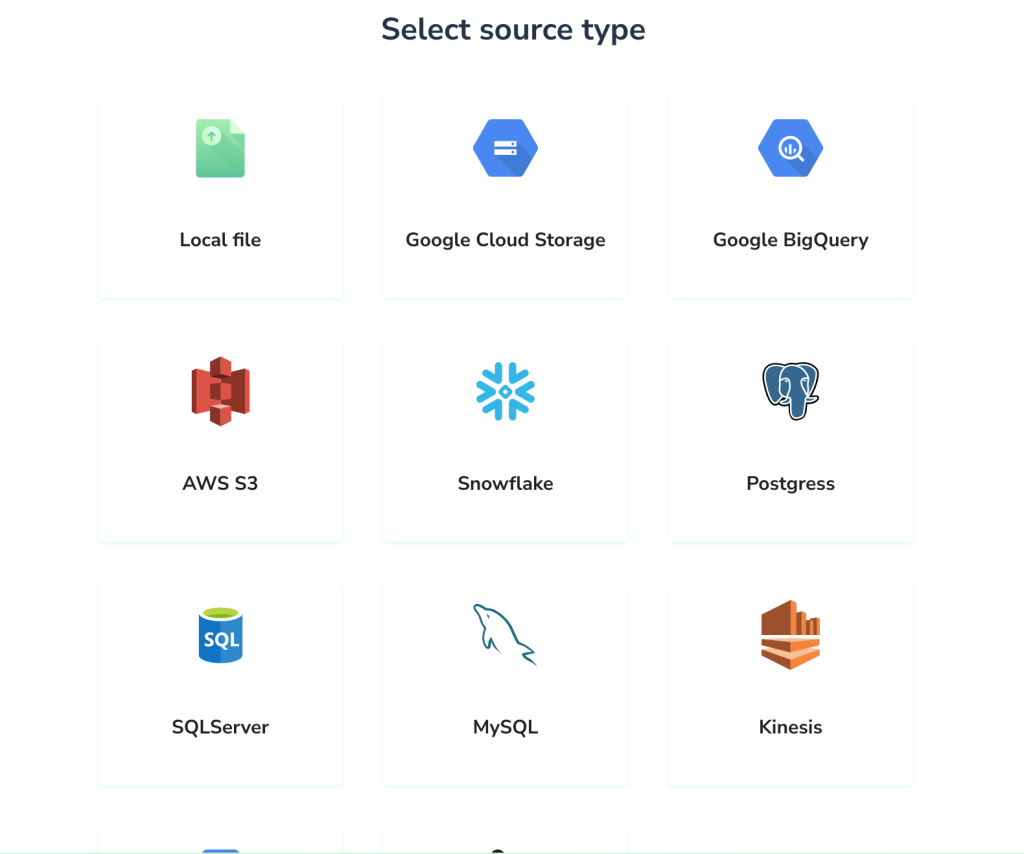
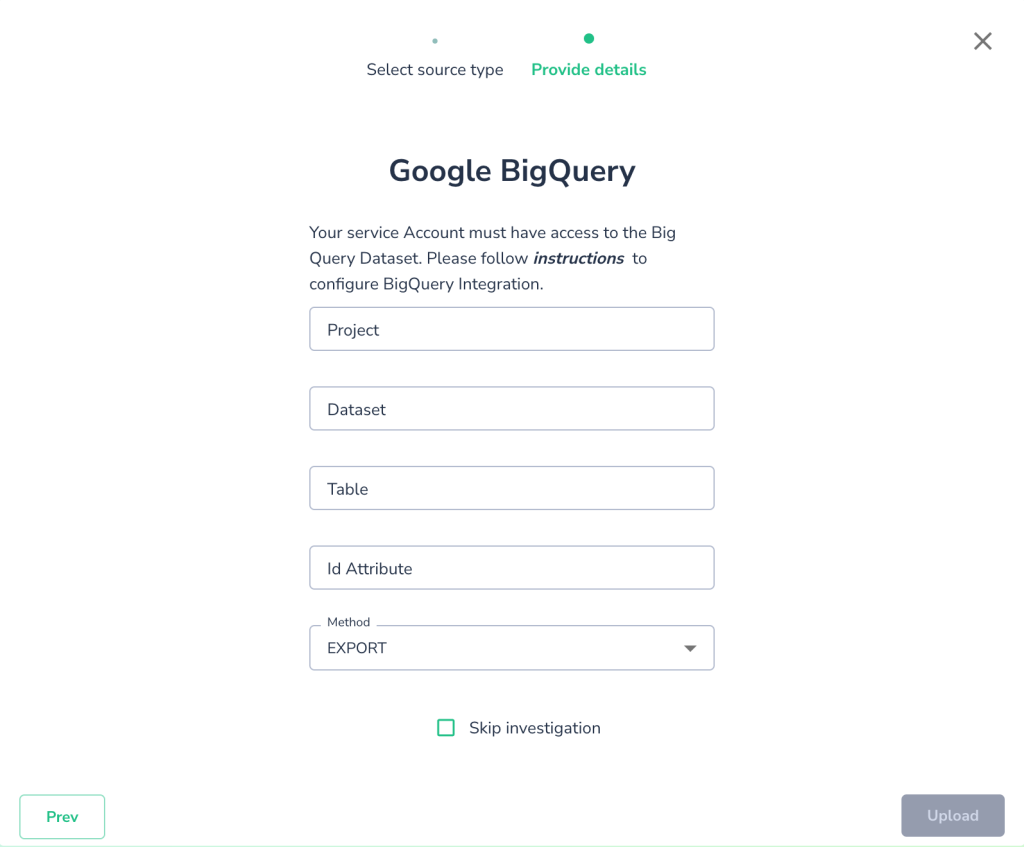
For example, let’s connect to a BigQuery View. All it needs is the dataset name, table/view name and optional Id Attribute, if you have one, so Telmai can track the number of duplicate records:
Once connected, Telmai starts observing the data. It learns historic trends on the data and starts making predictions when an unexpected drift is detected.
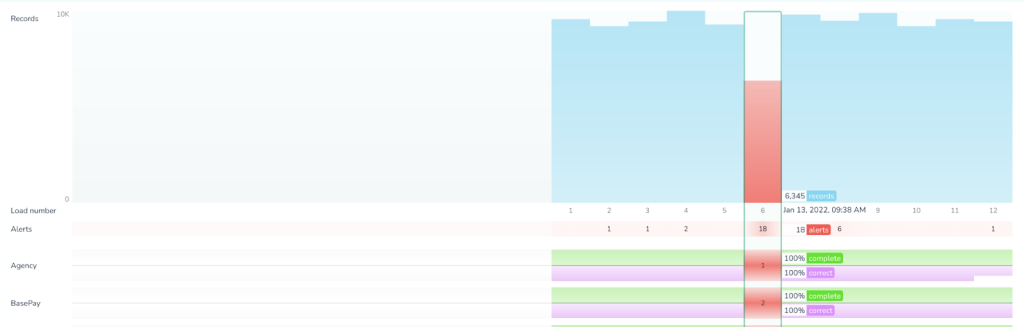
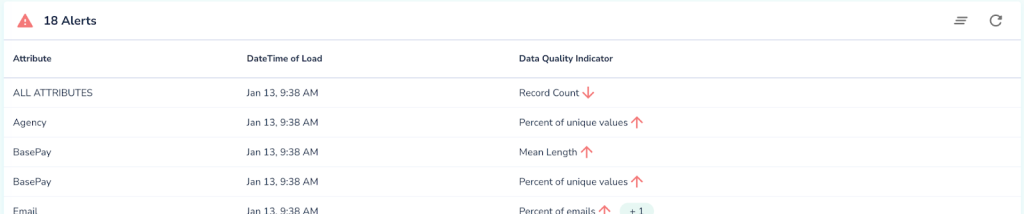
In this instance there is a particularly bad batch, happened at 9:38AM on Jan 13. There are 18 alerts total across all attributes due to various drifts, including significant dip in volume of the data observed.
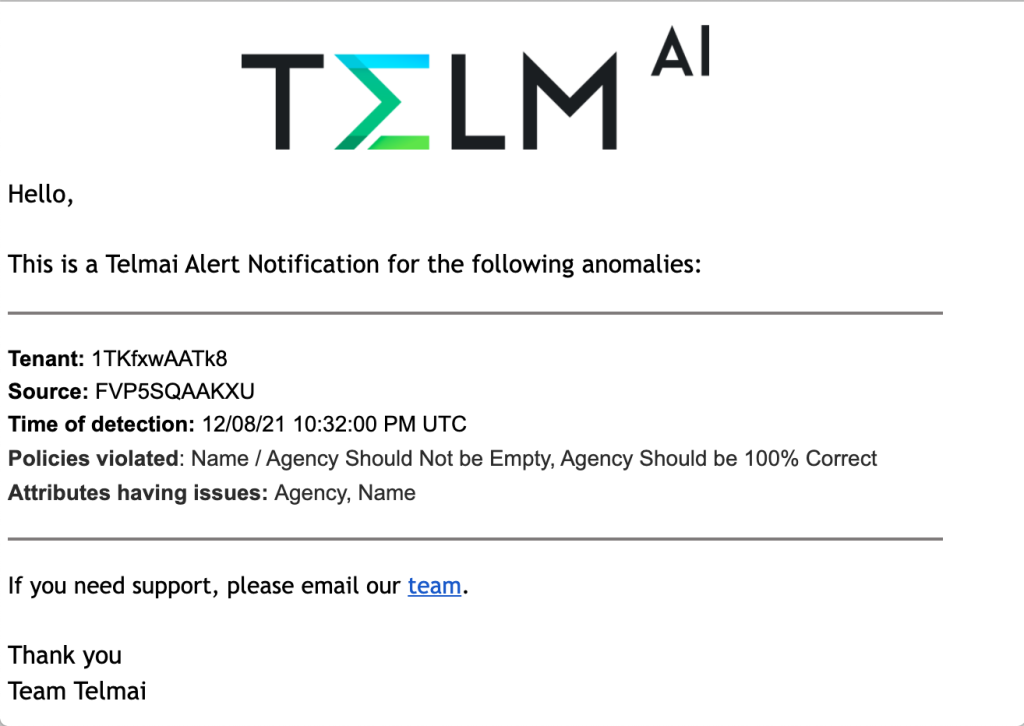
When this happens Telmai proactively notifies users via slack or email.
Telmai automatically tracks drifts in volume, completeness, uniqueness of values as well as shape of the data, e.g. patterns, distributions, lengths, special characters etc.
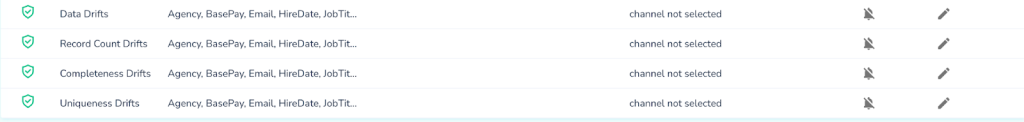
For each of such policies users can select a list of attributes to be monitored, whether or not to receive a notification and a channel for the notification, ex. email.
Users can see all information about alerts and violations in each of the attributes and drill down to see exactly what went wrong and get more details for their root cause analysis.
We can notice that one of the alerts was for a drift in Record Count, so it would be helpful to understand what was the historic trend and prediction based on that trend and what was the observed value:
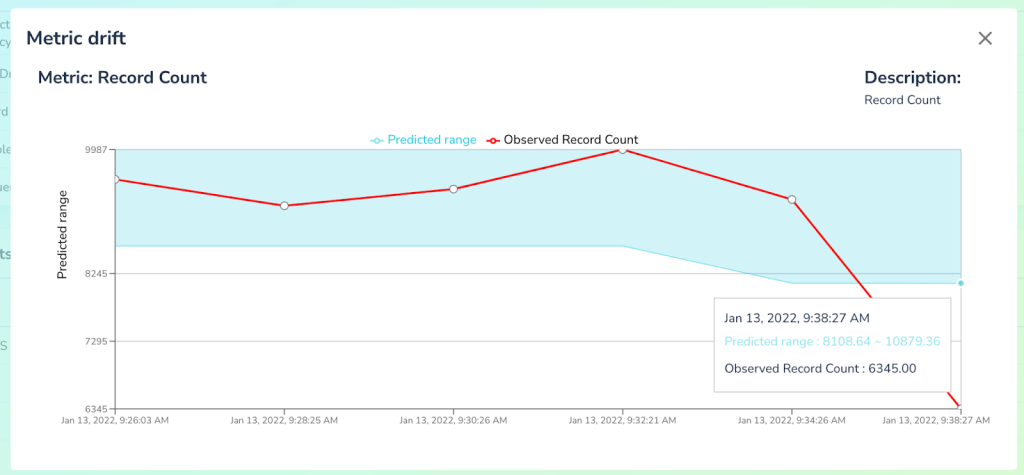
By clicking on that alert we can now see that based on the historical data system expected to see significantly more records than it received and hence generated the alert.
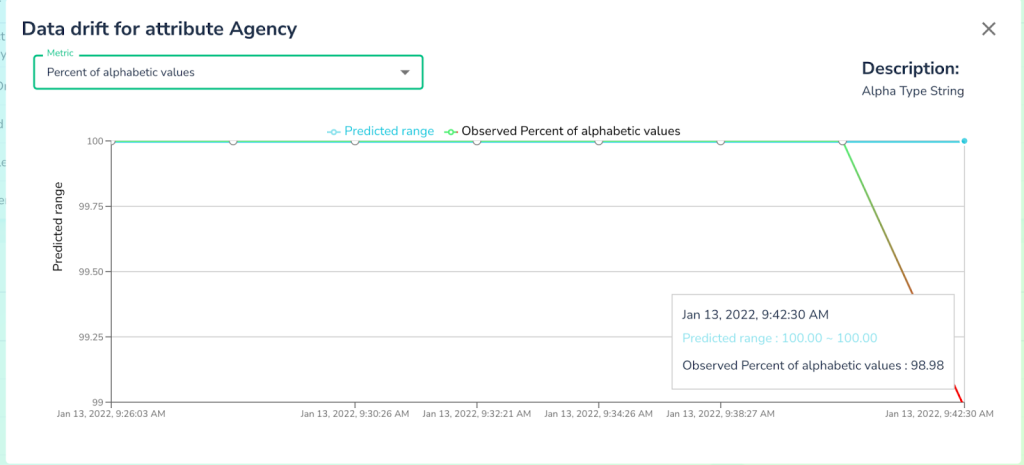
Similarly with other types of drifts, Telmai can register a wide variety of anomalies and present them to users. Below we see that in the Agency attribute there were 4 different observations of drifts detected: unexpected drop in ratios of alphabetic values, jump in numeric values, as well as increase in mean number of tokens and special characters. All of these are signs of bad data influx.
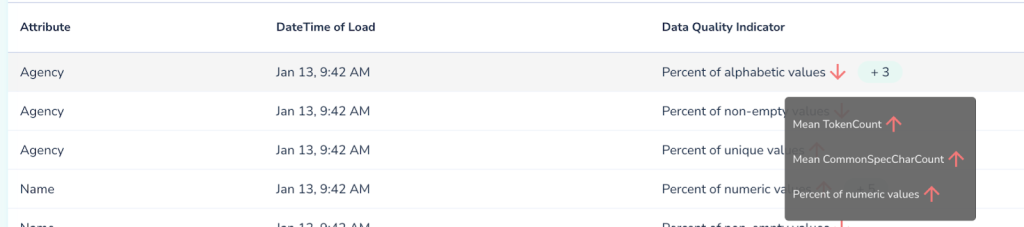
And now we can understand why the system generated an alert by comparing predictions based on historical trend with the observations.
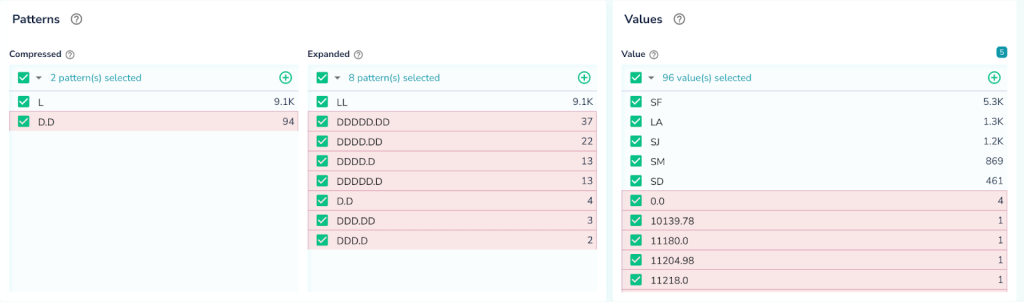
To verify that, Telmai also allows users to drill down and see the exact values which were detected as anomalous, saving users a lot of time and effort by not having to scramble through multiple systems and writing dozens of queries to figure it out. With a click of a button we can easily see a significant influx of bad data.
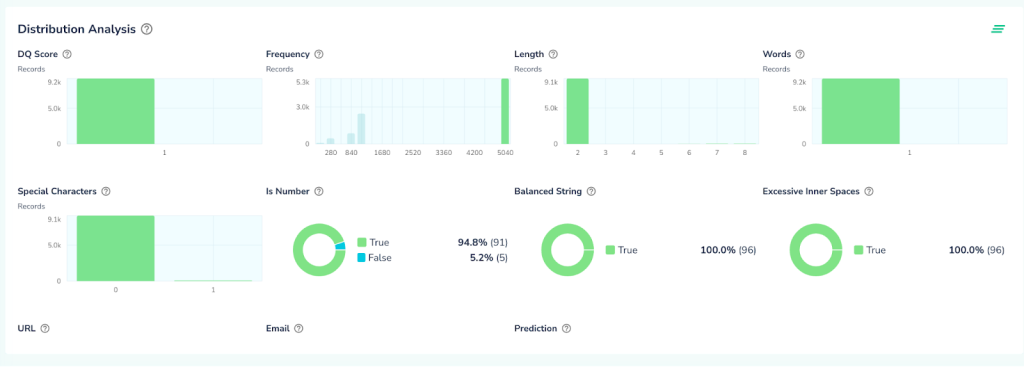
Telmai Investigator offers a variety of interactive tools for users for finding blind spots in the data and automatically suggests anomalies. These tools include pattern analyzer, anomaly scores and distribution analyzer.
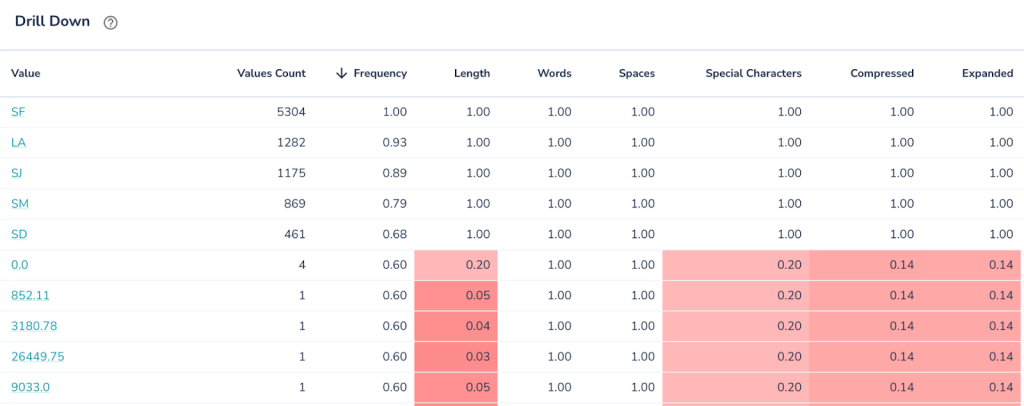
In this picture we see each value get’s scored on number of aspects. The lower the score (highlighted in red) the more anomalous the value is. Sorting data by various anomality aspects greatly helps in identifying blind spots in the data.
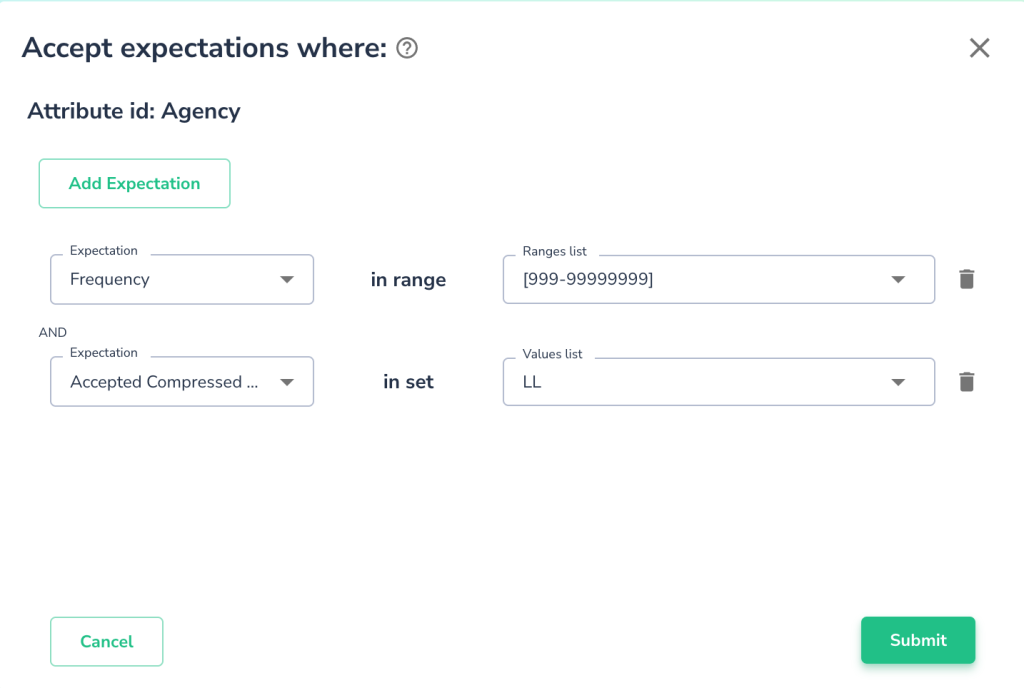
When users explore their data via Telmai’s automated tools, they gain insights and might find it useful to further refine the system by adding relevant expectations manually. For example, a user may add an expectation for the attribute Agency’s values to be of a 2-letter pattern and have a frequency count of at least 1000 as shown below:
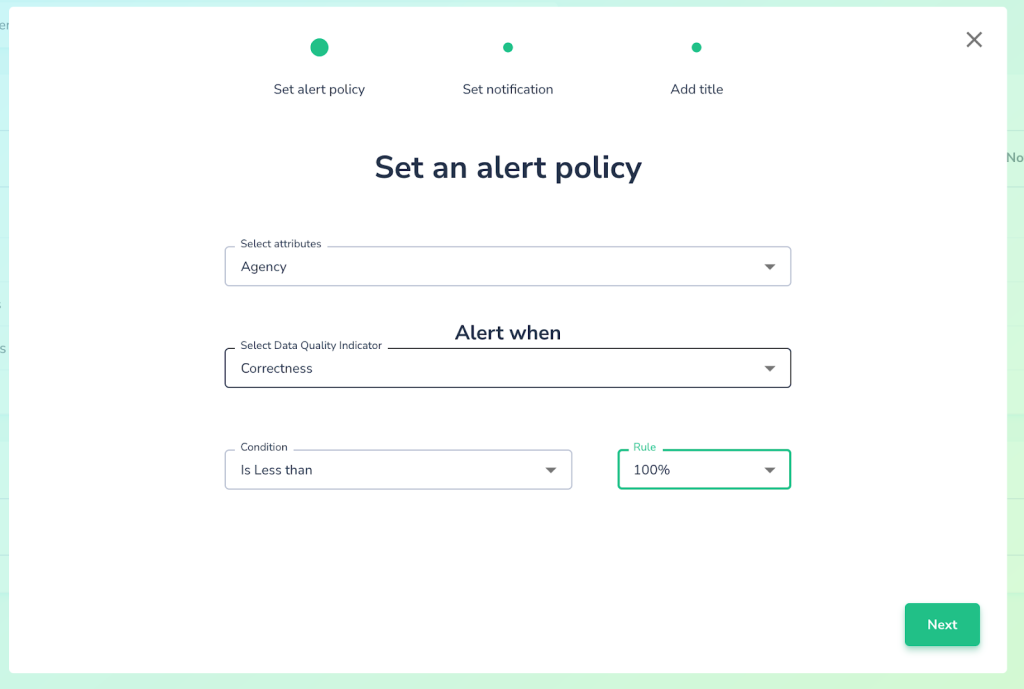
Once such an expectation is set, users can specify an alert policy based on correctness level tolerance. For example, the user may want to be alerted whenever the correctness of such Agency’s expectation drops below 100% (see the illustration below). In this case, the user has zero tolerance for policy violation. Had the user chosen 95% instead, the violation tolerance is 5% and, thus, an alert will be issued only when the expectation is violated by at least 5% of the records.
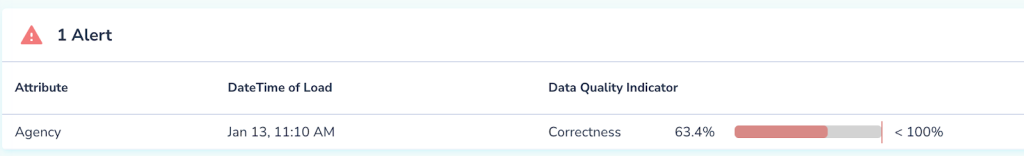
Next time data is processed, Telmai will apply newly defined correctness policy and alert users when number of correct values is less than was expected:
As a summary, Telmai provides a powerful AI engine for automated detection of anomalies in the data without requiring any prior configuration or setup. It also powers the users with the ability to refine, and further tune the system, without any coding requirements. This allows for unlocking this conveniently useful platform for broader and more diverse data teams.
You can sign up for a demo and see it for yourself.
Passionate about data quality? Get expert insights and guides delivered straight to your inbox – click here to subscribe to our newsletter now.
- On this page
See what’s possible with Telmai
Request a demo to see the full power of Telmai’s data observability tool for yourself.