What’s New With Telmai – 2026
Telmai’s latest product updates focus on prioritizing what matters, integrating with the catalogs and ticketing tools teams already use, and running wherever your data lives. With a redesigned experience, AI-assisted root cause analysis, and hybrid deployment, trusting your data just got easier.

The industry is moving toward a unified context layer, where catalogs and observability work as one. Catalogs, semantic layers and ontologies supply derived context, which defines what data should mean. Observed context, in contrast, shows how the data actually behaves. As AI agents become primary consumers of enterprise data, they need both at the moment they act.
Over the past few months, we’ve made significant enhancements to Telmai to bring observed context into the tools your teams already use, wherever your data lives. Here’s what’s new.
Building A Unified Context Layer
Enterprise data teams are moving to hybrid lakehouse architectures. Thousands of tables flow through multiple pipelines and curated layers before they power operations, reporting and AI applications.
Agentic applications act on data in real time but can’t verify whether it’s fit for use. With no analyst in the loop to catch a bad record, they need observed context alongside the catalog’s derived context. The most telling signal is often a mismatch between what the catalog says and what the data shows. For example, a table marked as certified may have stopped refreshing three days ago. Missing it adds decision latency for agentic applications.
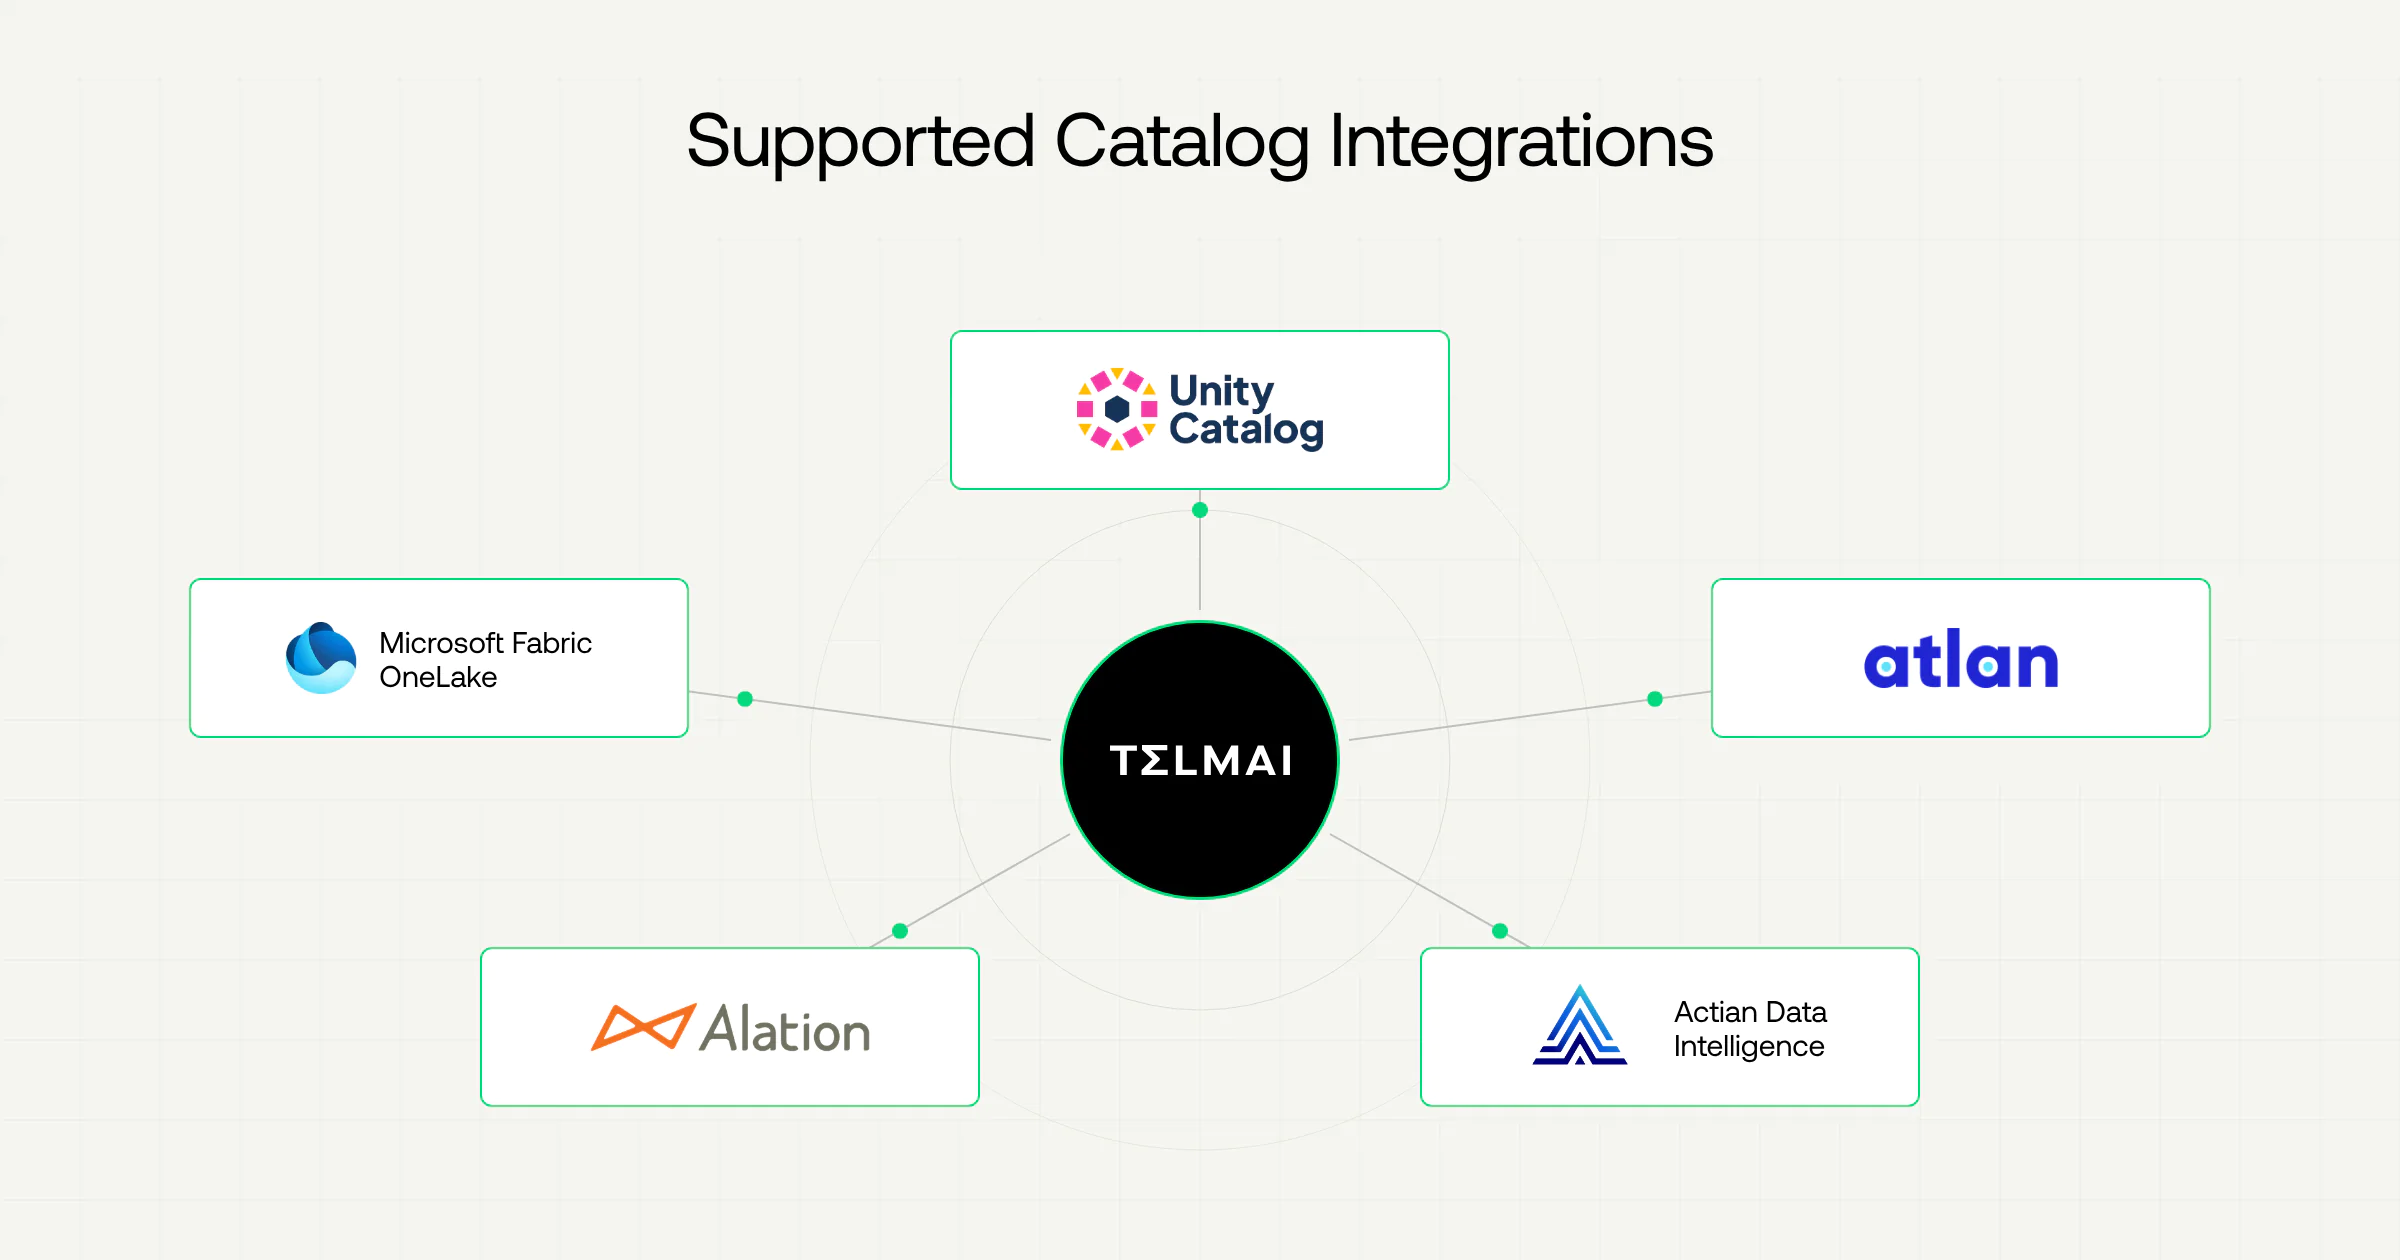
The catalog is the natural home for a unified context layer, since it’s where teams already govern their data. So we’ve built deeper integrations with the catalogs they run, including Databricks Unity Catalog, Atlan, Microsoft OneLake catalog, Actian Data Intelligence and Alation.
Telmai connects through the catalog and reads the whole estate, from glossary terms, ownership and tags to usage and lineage. It uses those signals to rank critical data elements, recommend monitors and validate the full data population where it lives, not a sample. Context then flows back. Incidents carry their downstream blast radius from lineage, quality context is written back where the catalog supports it, and agents reach both kinds of context through Telmai’s MCP server.
Learn more in our catalog integration docs page.
A Redesigned Experience For Faster Time To Resolution
Monitoring every asset is easy. Knowing which assets matter, across many pipelines that each carry their own business context, is the hard part for enterprise data teams.
Unified View Of Data Health Across Your Estate
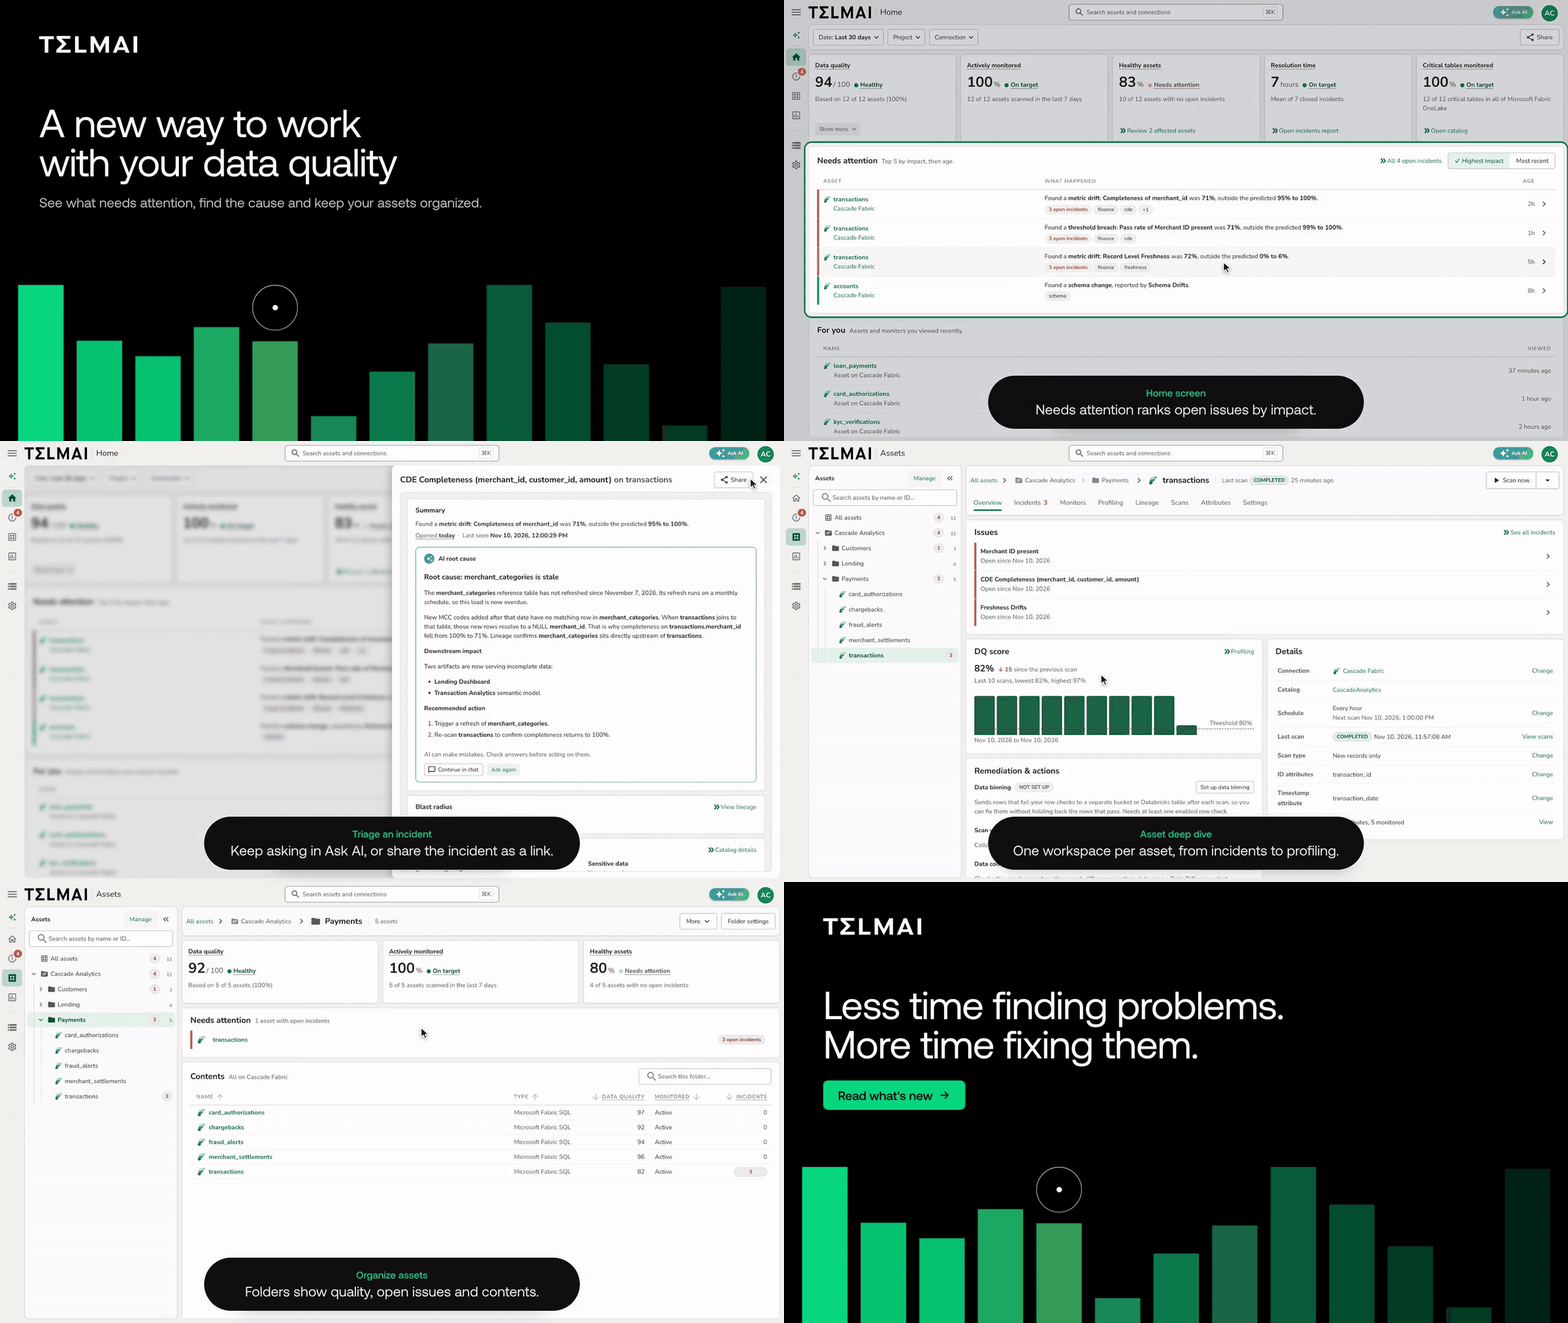
We’ve redesigned the Telmai experience so teams can see what matters and act on it quickly. The new home page shows the data quality trend across all your sources. Next to it, you see monitoring coverage and the incidents that need attention first, ranked by impact. Then select any asset to open its workspace. From there, compare scans side by side to see what changed.
Learn more in our Home and Managing Assets docs pages.
Faster Incident Triage & Investigation
Most alerts stop at “something failed.” Data teams still have to triage the breach, trace lineage, pull failing records and rebuild the context before anyone can act.
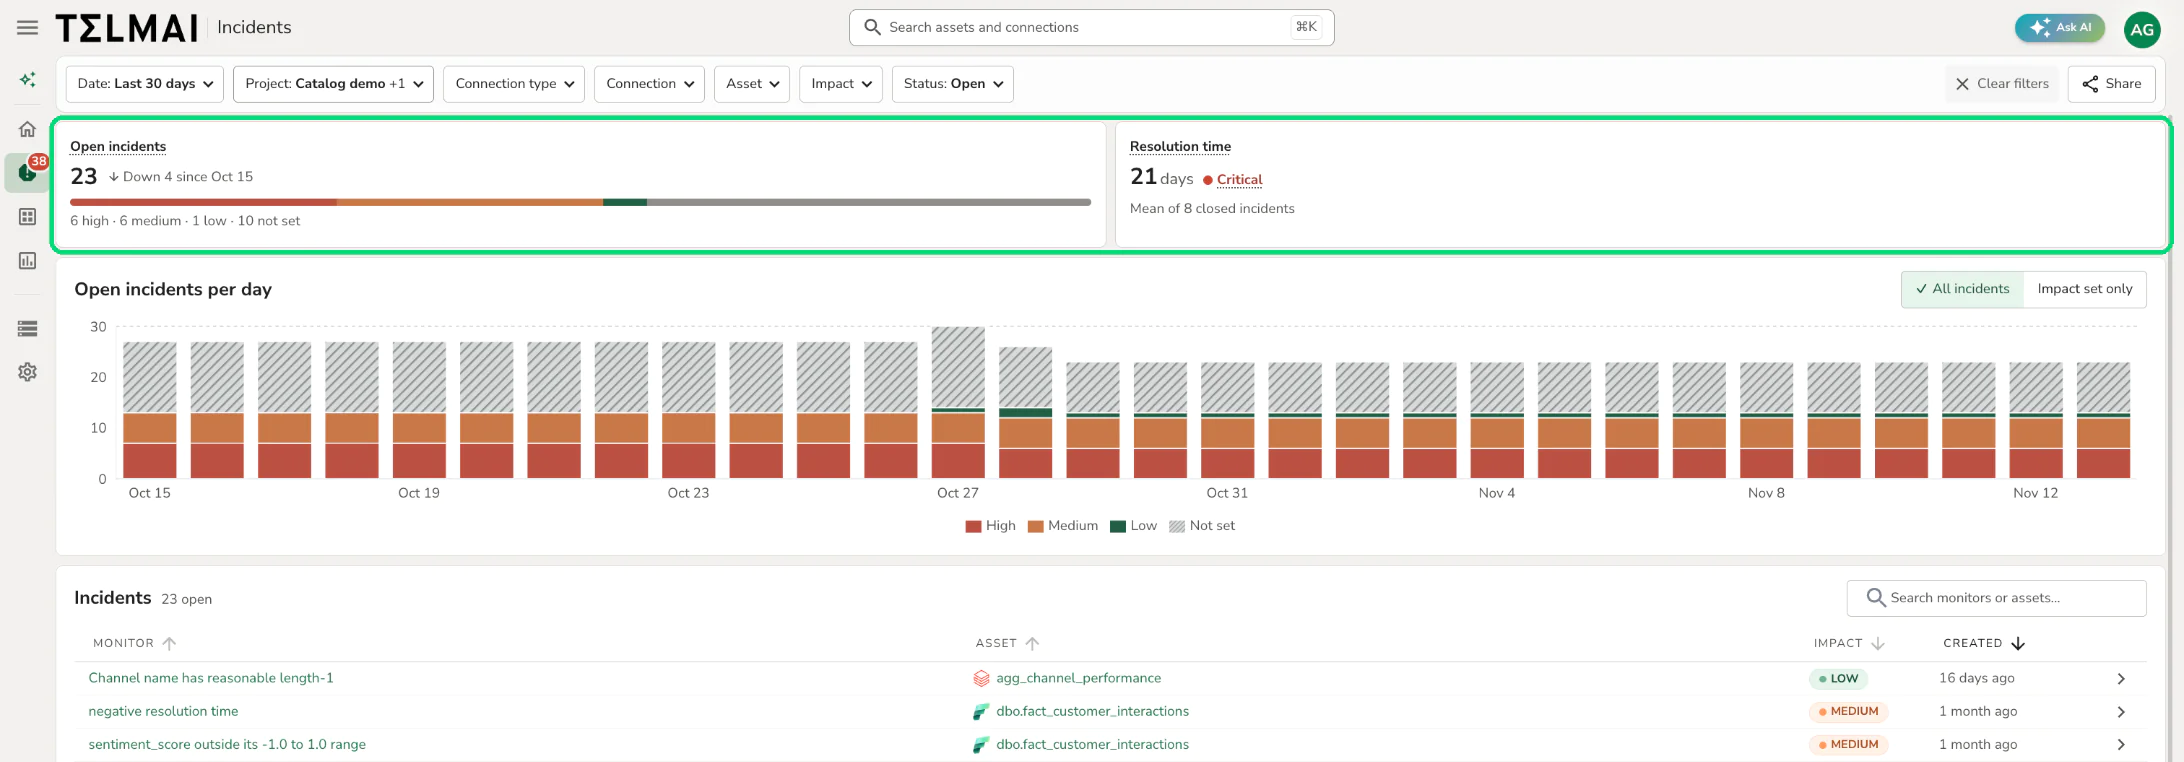
The redesigned Incidents page is where triage begins. Open incidents are broken down by impact and charted day by day, and filters narrow the view by project, connection or asset. Mean resolution time sits alongside, so teams work the riskiest issues first and can see whether resolution is getting faster.
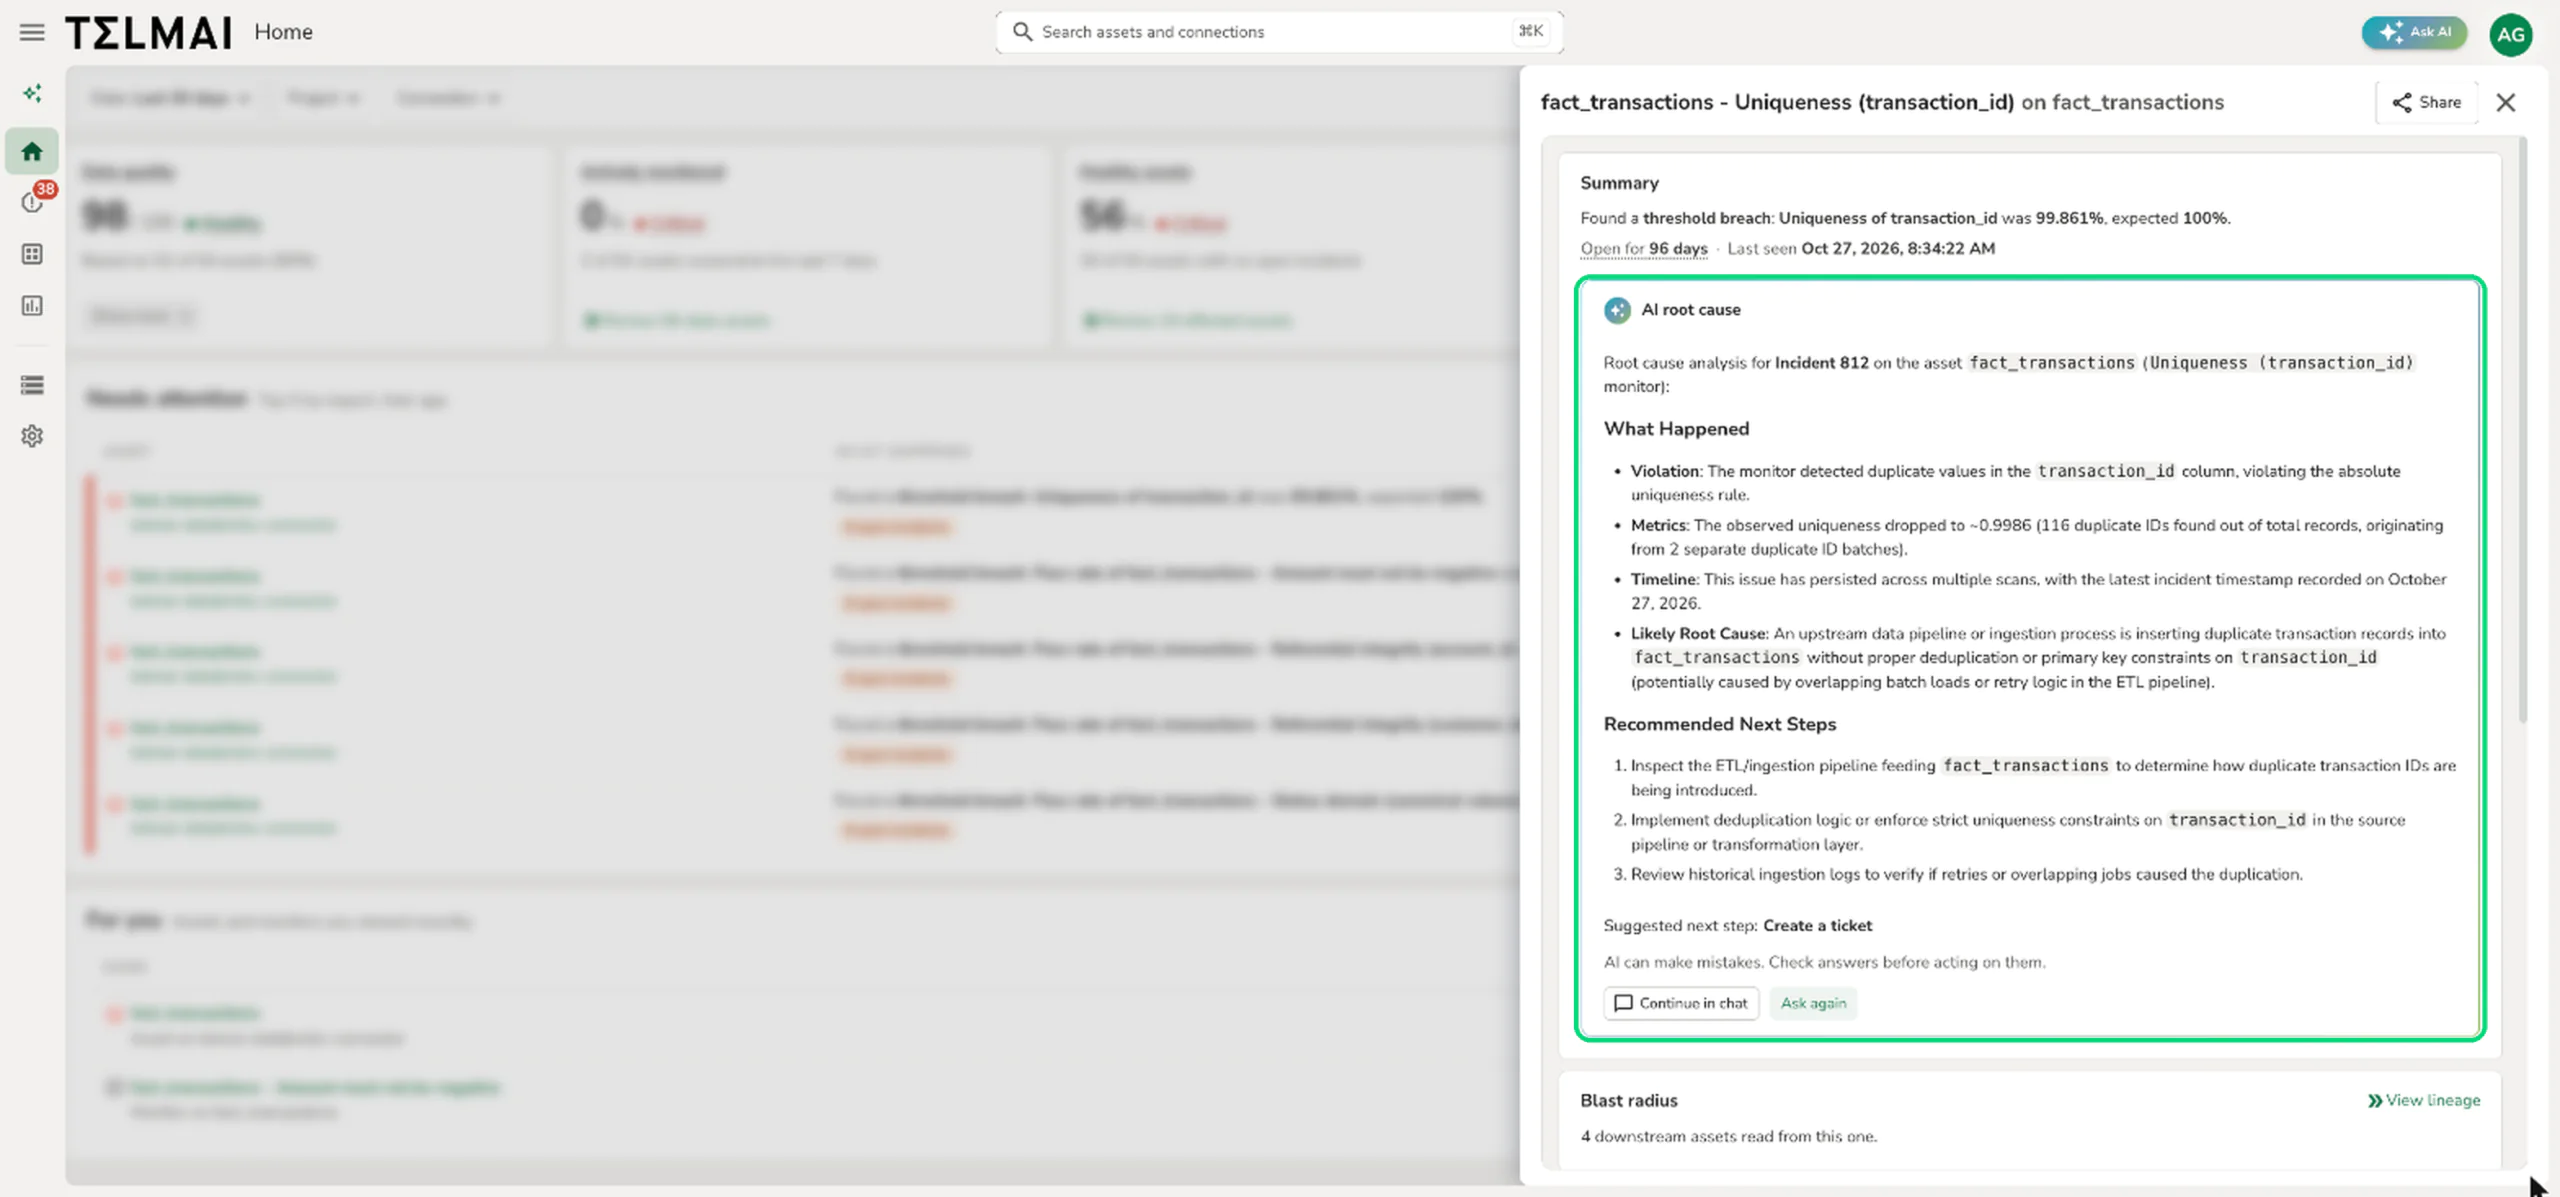
Every incident in Telmai now opens in a side panel with complete context built in. It shows what breached its expected threshold, with the failing records one click away. A blast radius drawn from lineage shows which downstream assets read from the affected table. Telmai’s AI agent then investigates the incident and returns the most likely root cause, the downstream impact and a suggested next step.
Teams go from alert to action in one view, and fix the issue at the source instead of patching it downstream.
Learn more in our Incidents and Ask AI docs pages.
Monitoring And Remediation Built Into Every Asset
Finding bad data is only half the job. Teams also need the right checks in place, a way to stop failing records from spreading and proof that quality is improving.
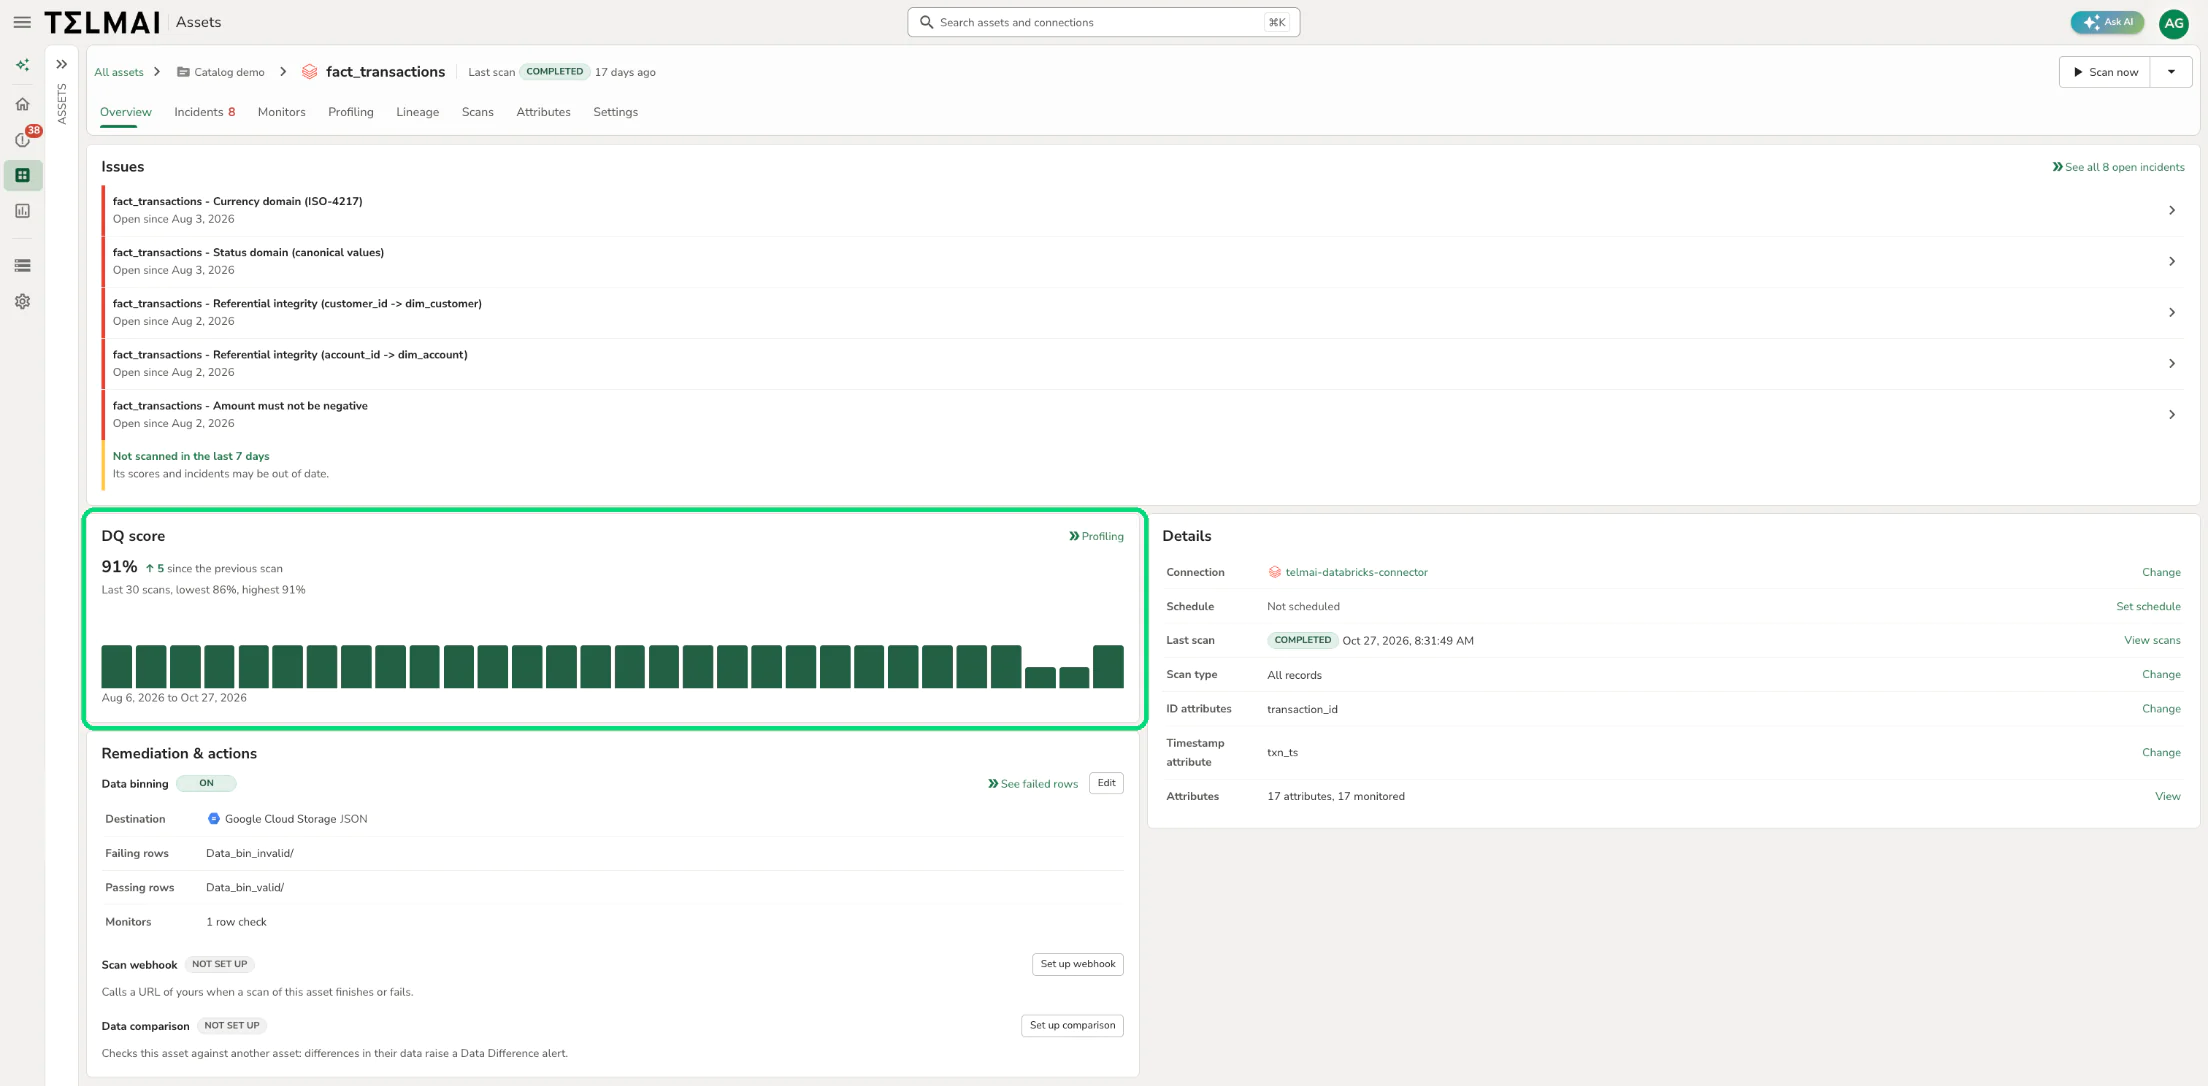
Every asset now has its own workspace, with tabs for incidents, monitors, profiling, lineage, scans, attributes and settings, and an asset tree to move between assets. The overview puts open issues at the top with how long each has been open. It also charts the DQ score across the last 30 scans with the change since the previous one.
Monitors are now created in four guided steps. Teams define the check, set how and when to alert stakeholders and route incidents into their ticketing workflow, so every failure lands with an owner.
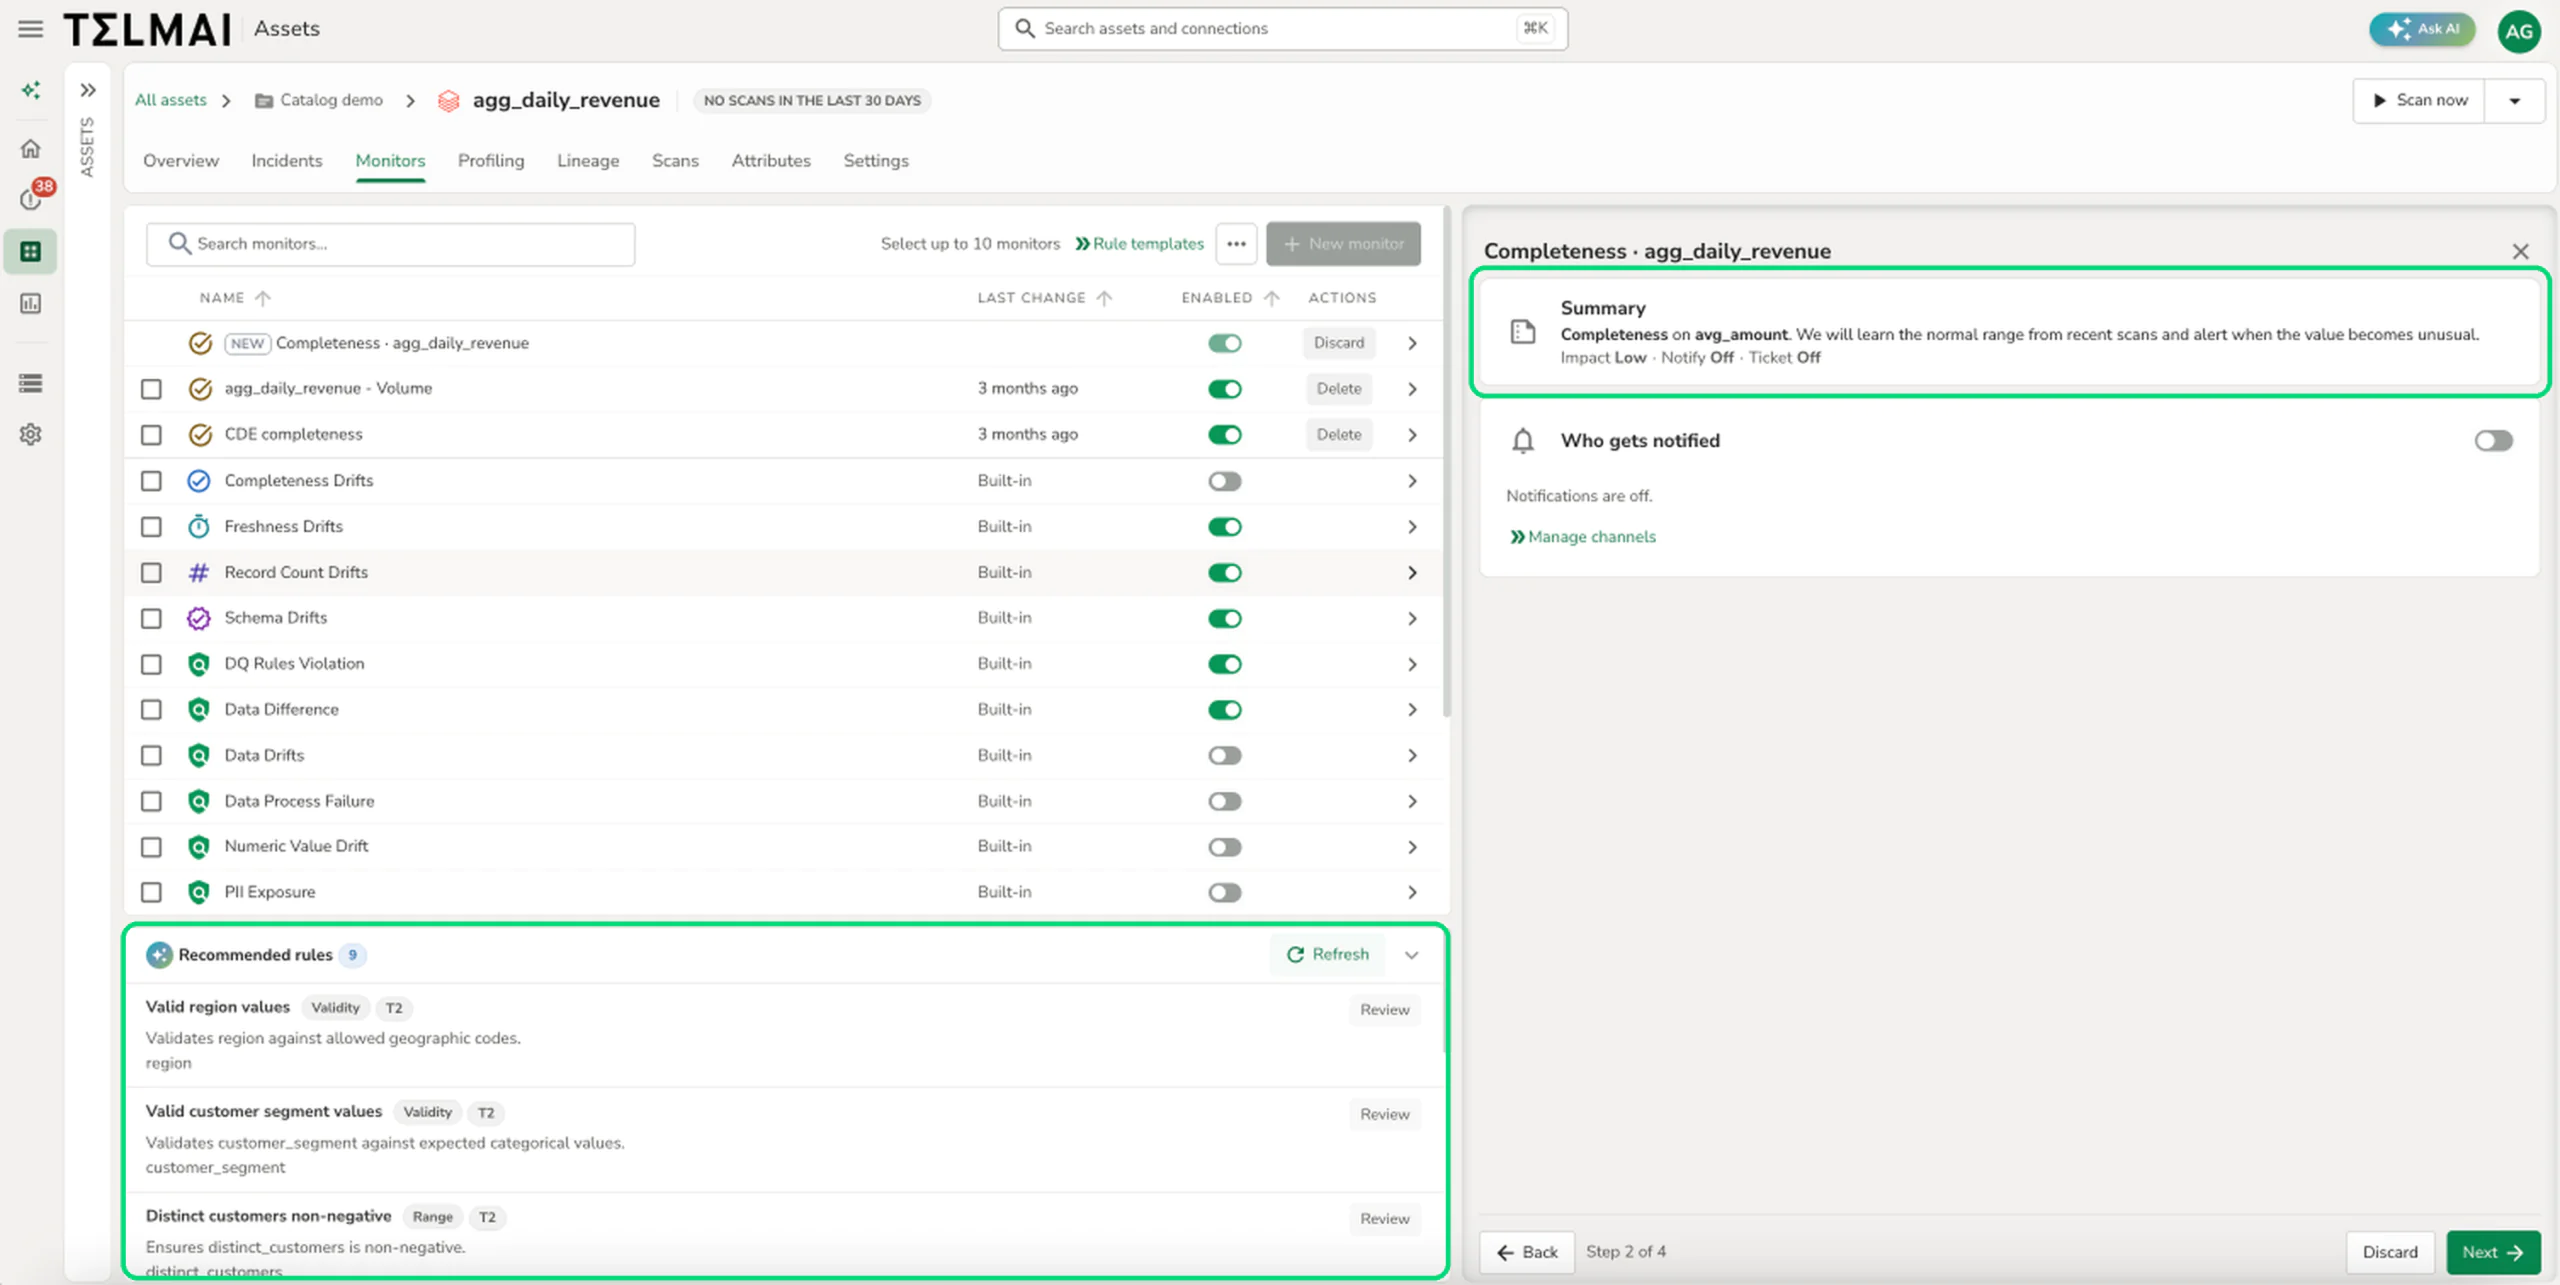
The Monitors tab also recommends rules tailored to each asset’s schema and data patterns. Each one names the check type and the column it covers, ready to review and add.
When a check fails, bad records don’t have to flow downstream. Data binning separates failing rows from passing ones and writes them to your storage or Databricks tables for review and reconciliation. From any incident, teams can jump straight to the failed rows.
Learn more in our Creating a Monitor, Monitor Recommendations and Data Binning docs pages.
Incidents Where Your Teams Already Work
ServiceNow Integration
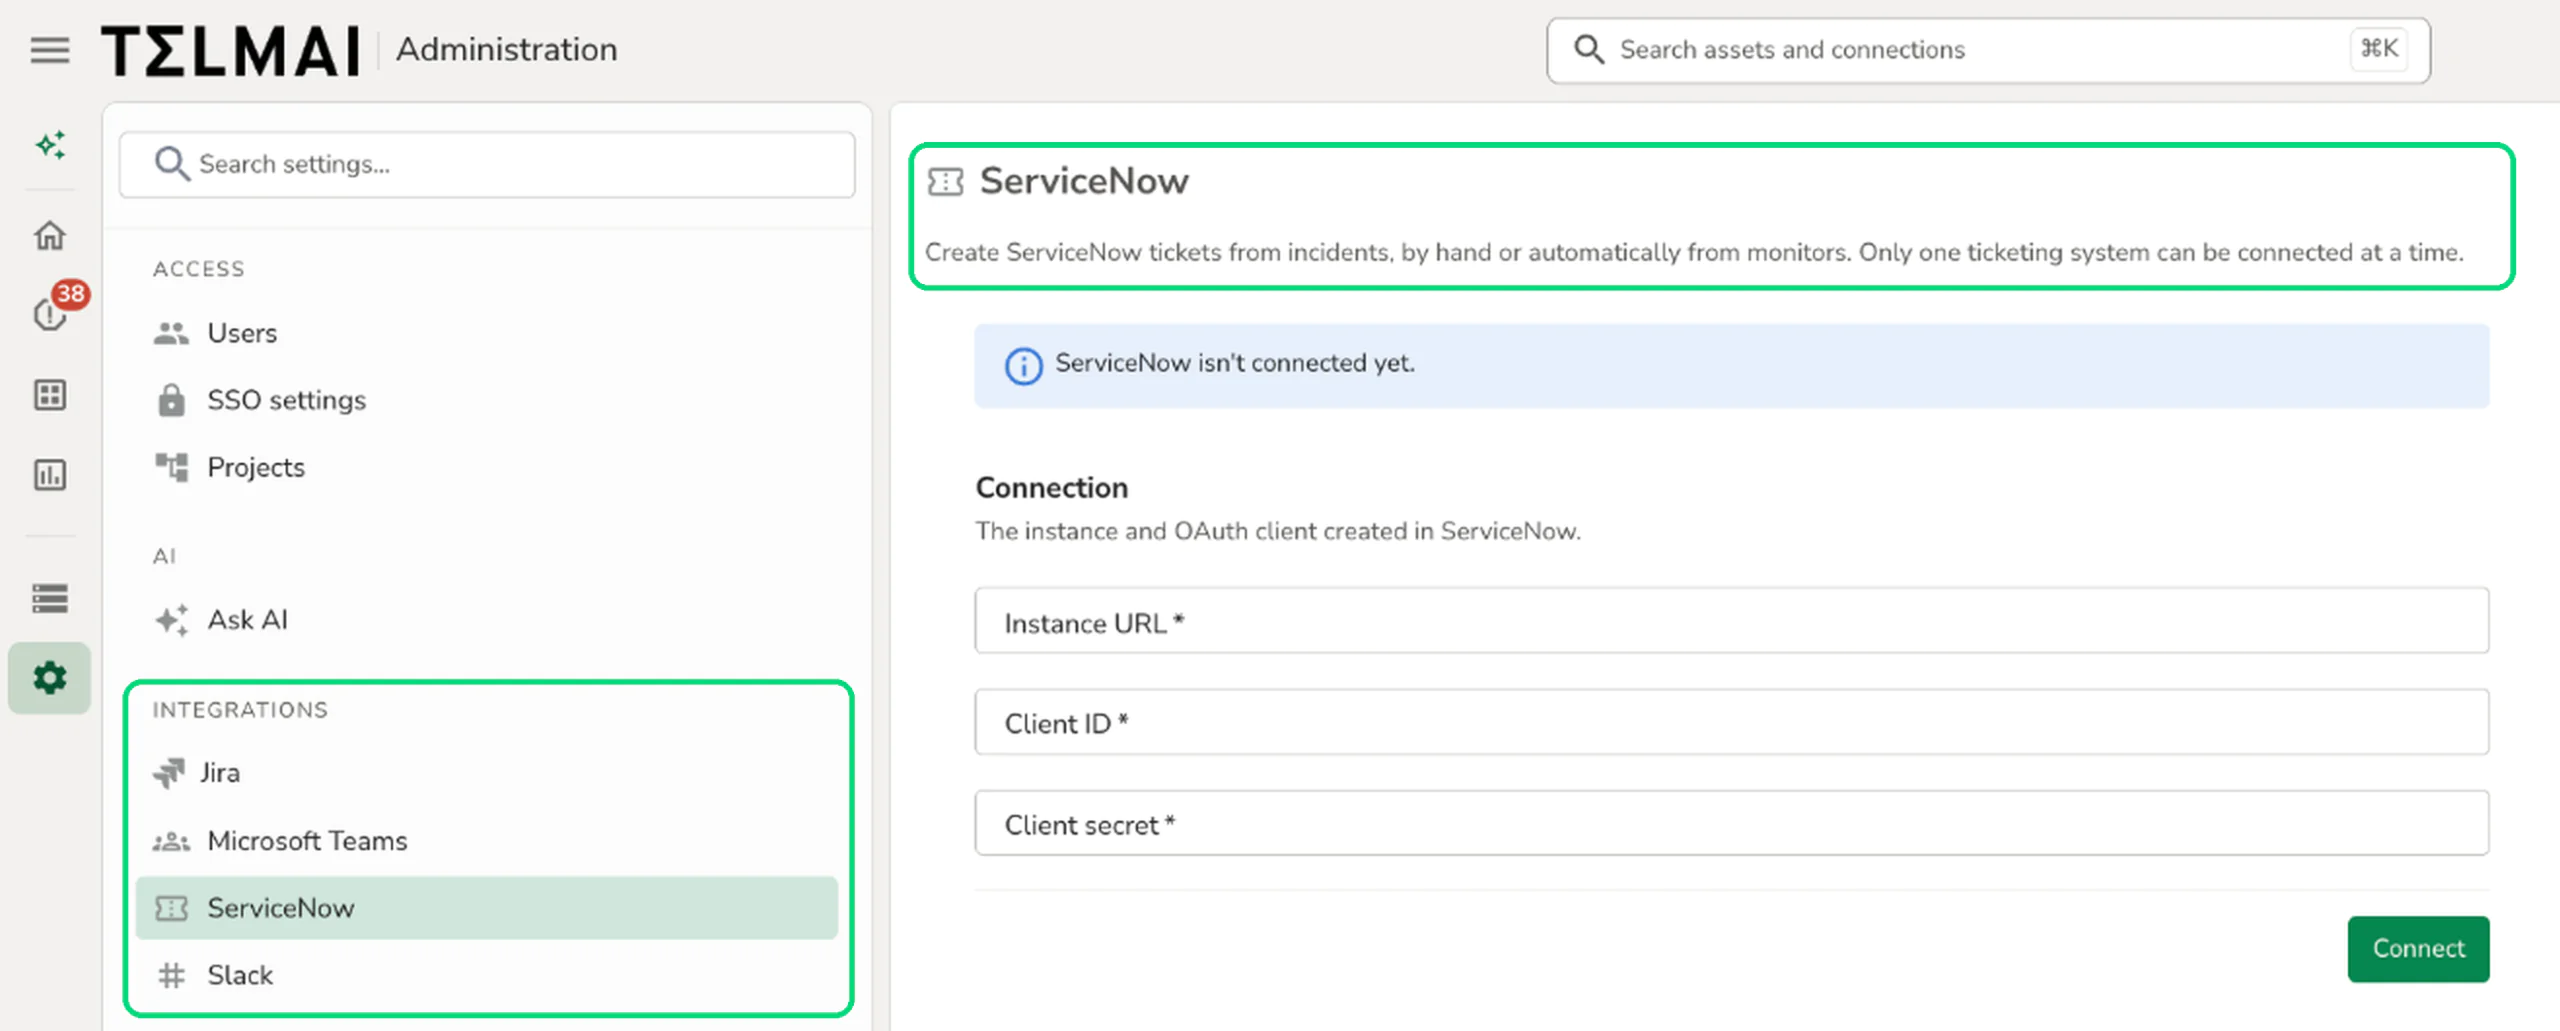
Telmai now connects to ServiceNow with OAuth client credentials, and ticket templates map incident details to the fields your teams rely on. Tickets are created automatically when a monitor opens an incident, or manually from any incident. As a result, data issues reach the right owners and follow the same escalation paths as everything else. Jira and ServiceNow are both supported, with one connected at a time.
Learn more in our ServiceNow integration docs page.
Slack and Microsoft Teams alerts also have their own settings in Administration, with notifications sent for each incident, as a scan summary or as a digest.
Learn more in our notifications docs page.
Trust Your Data Wherever It Lives
Where data is validated matters as much as what gets checked. Regulated teams need checks that run inside their own cloud, and engineering teams need them inside the pipelines they ship.
Hybrid Deployment
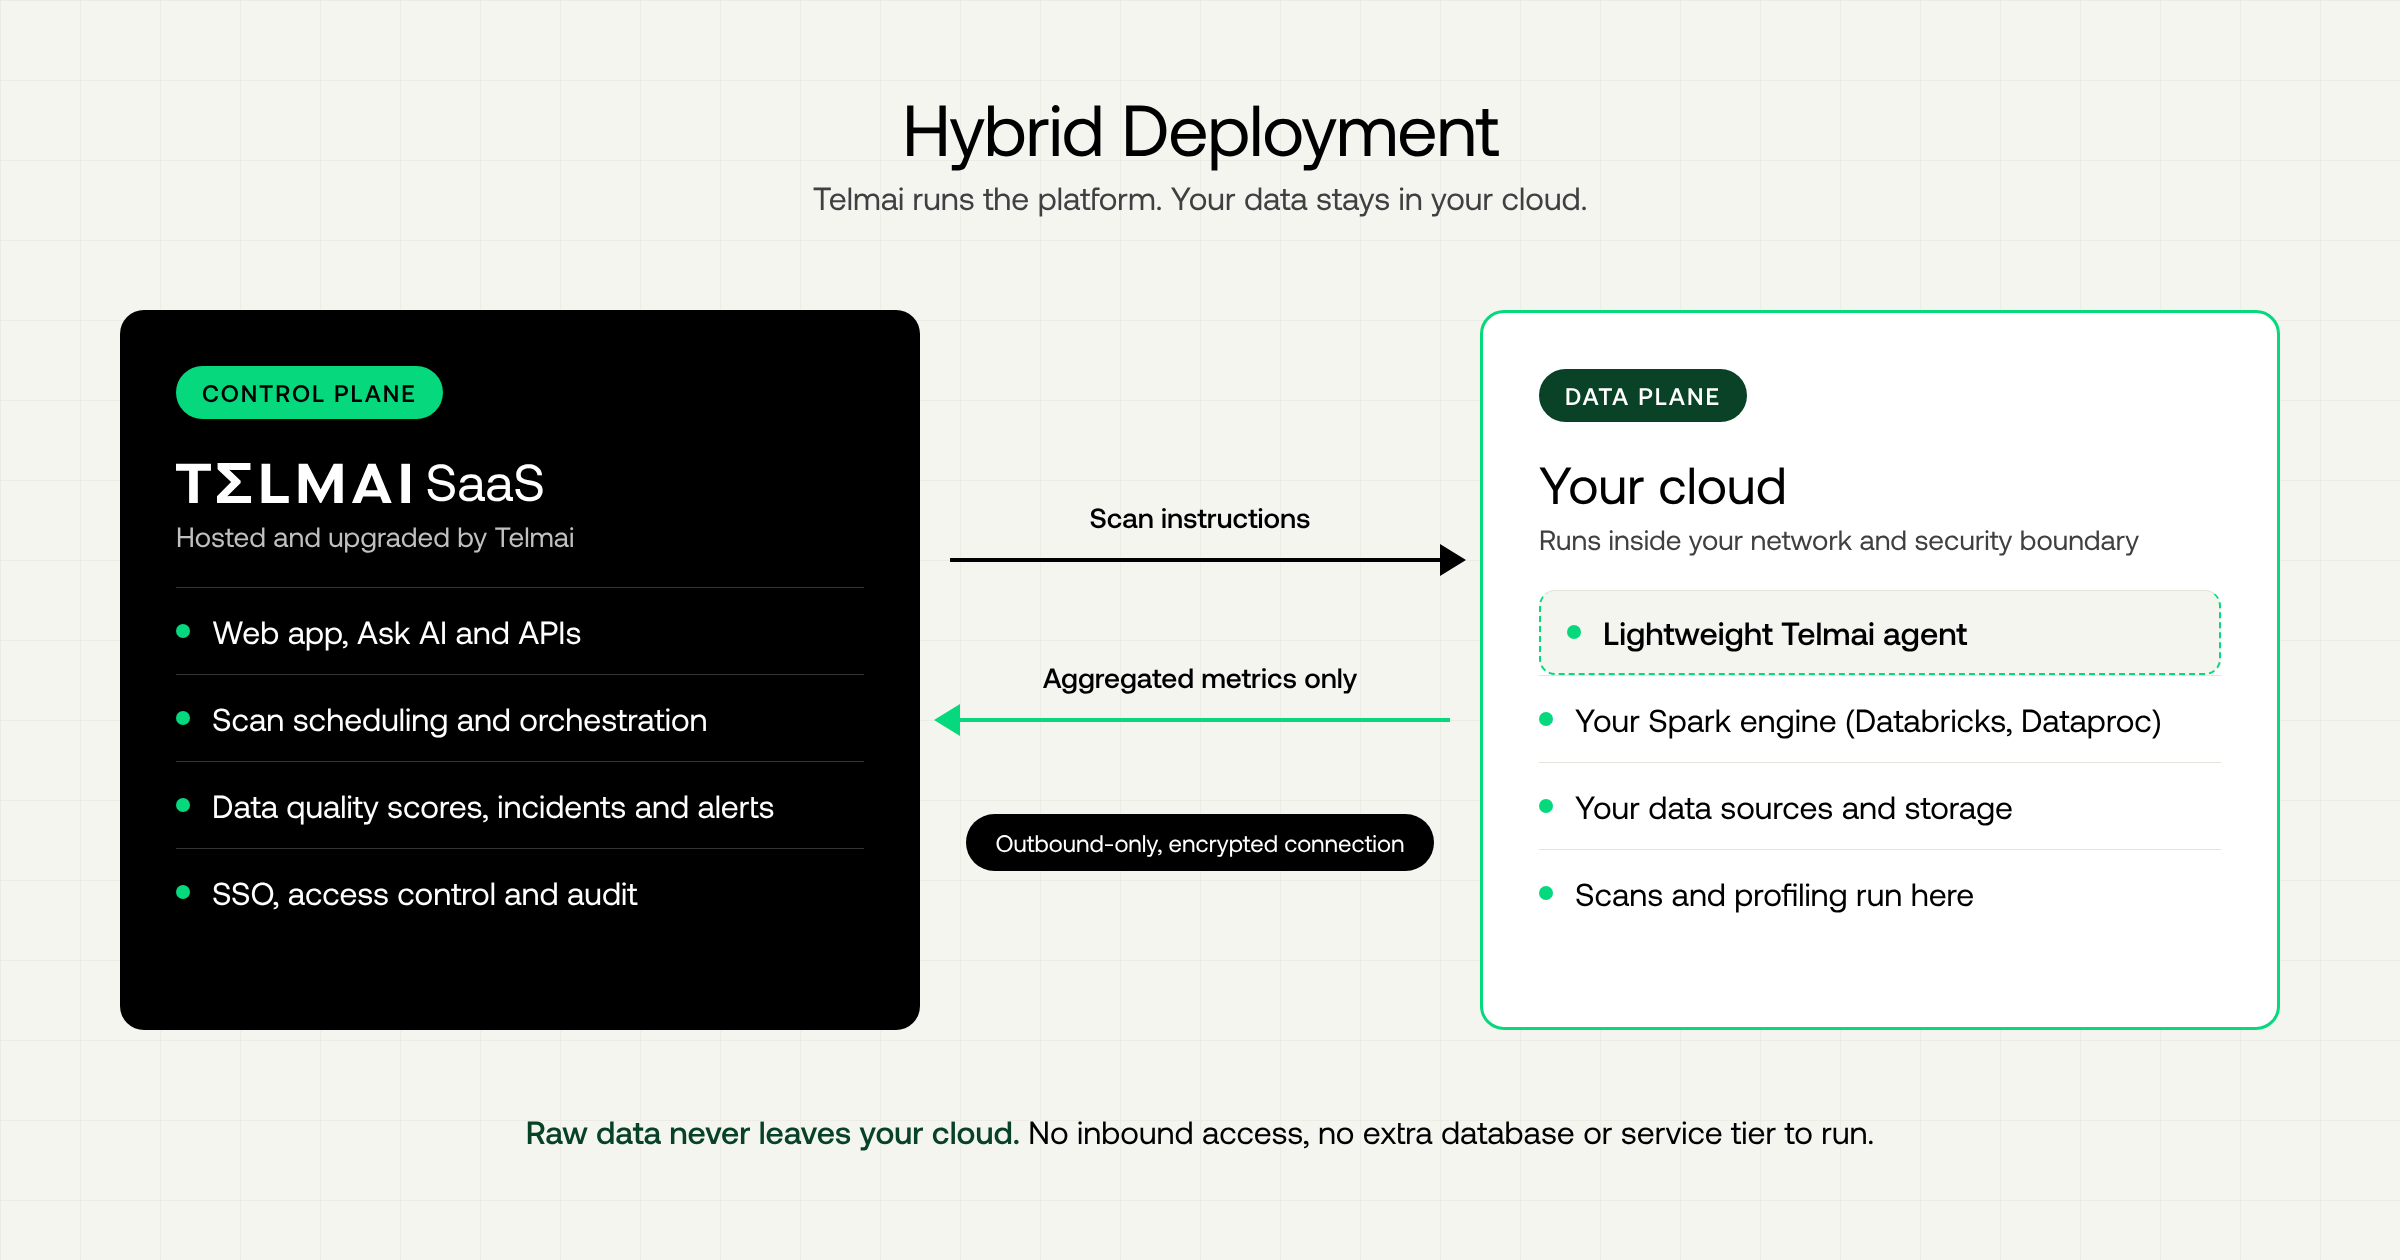
Regulated teams often can’t send data to a SaaS platform, and a full private deployment is a lot to operate. Hybrid deployment sits in between. Telmai hosts the control plane, while scans run on the Spark engine you already operate, whether that’s Azure Databricks, Databricks on AWS or Dataproc on GCP. A lightweight agent connects outbound only and sends back aggregated metrics, alert signals and job status. As a result, raw data never leaves your network, and there’s no extra database or service tier to run.
Learn more in our hybrid deployment docs page.
Python SDK
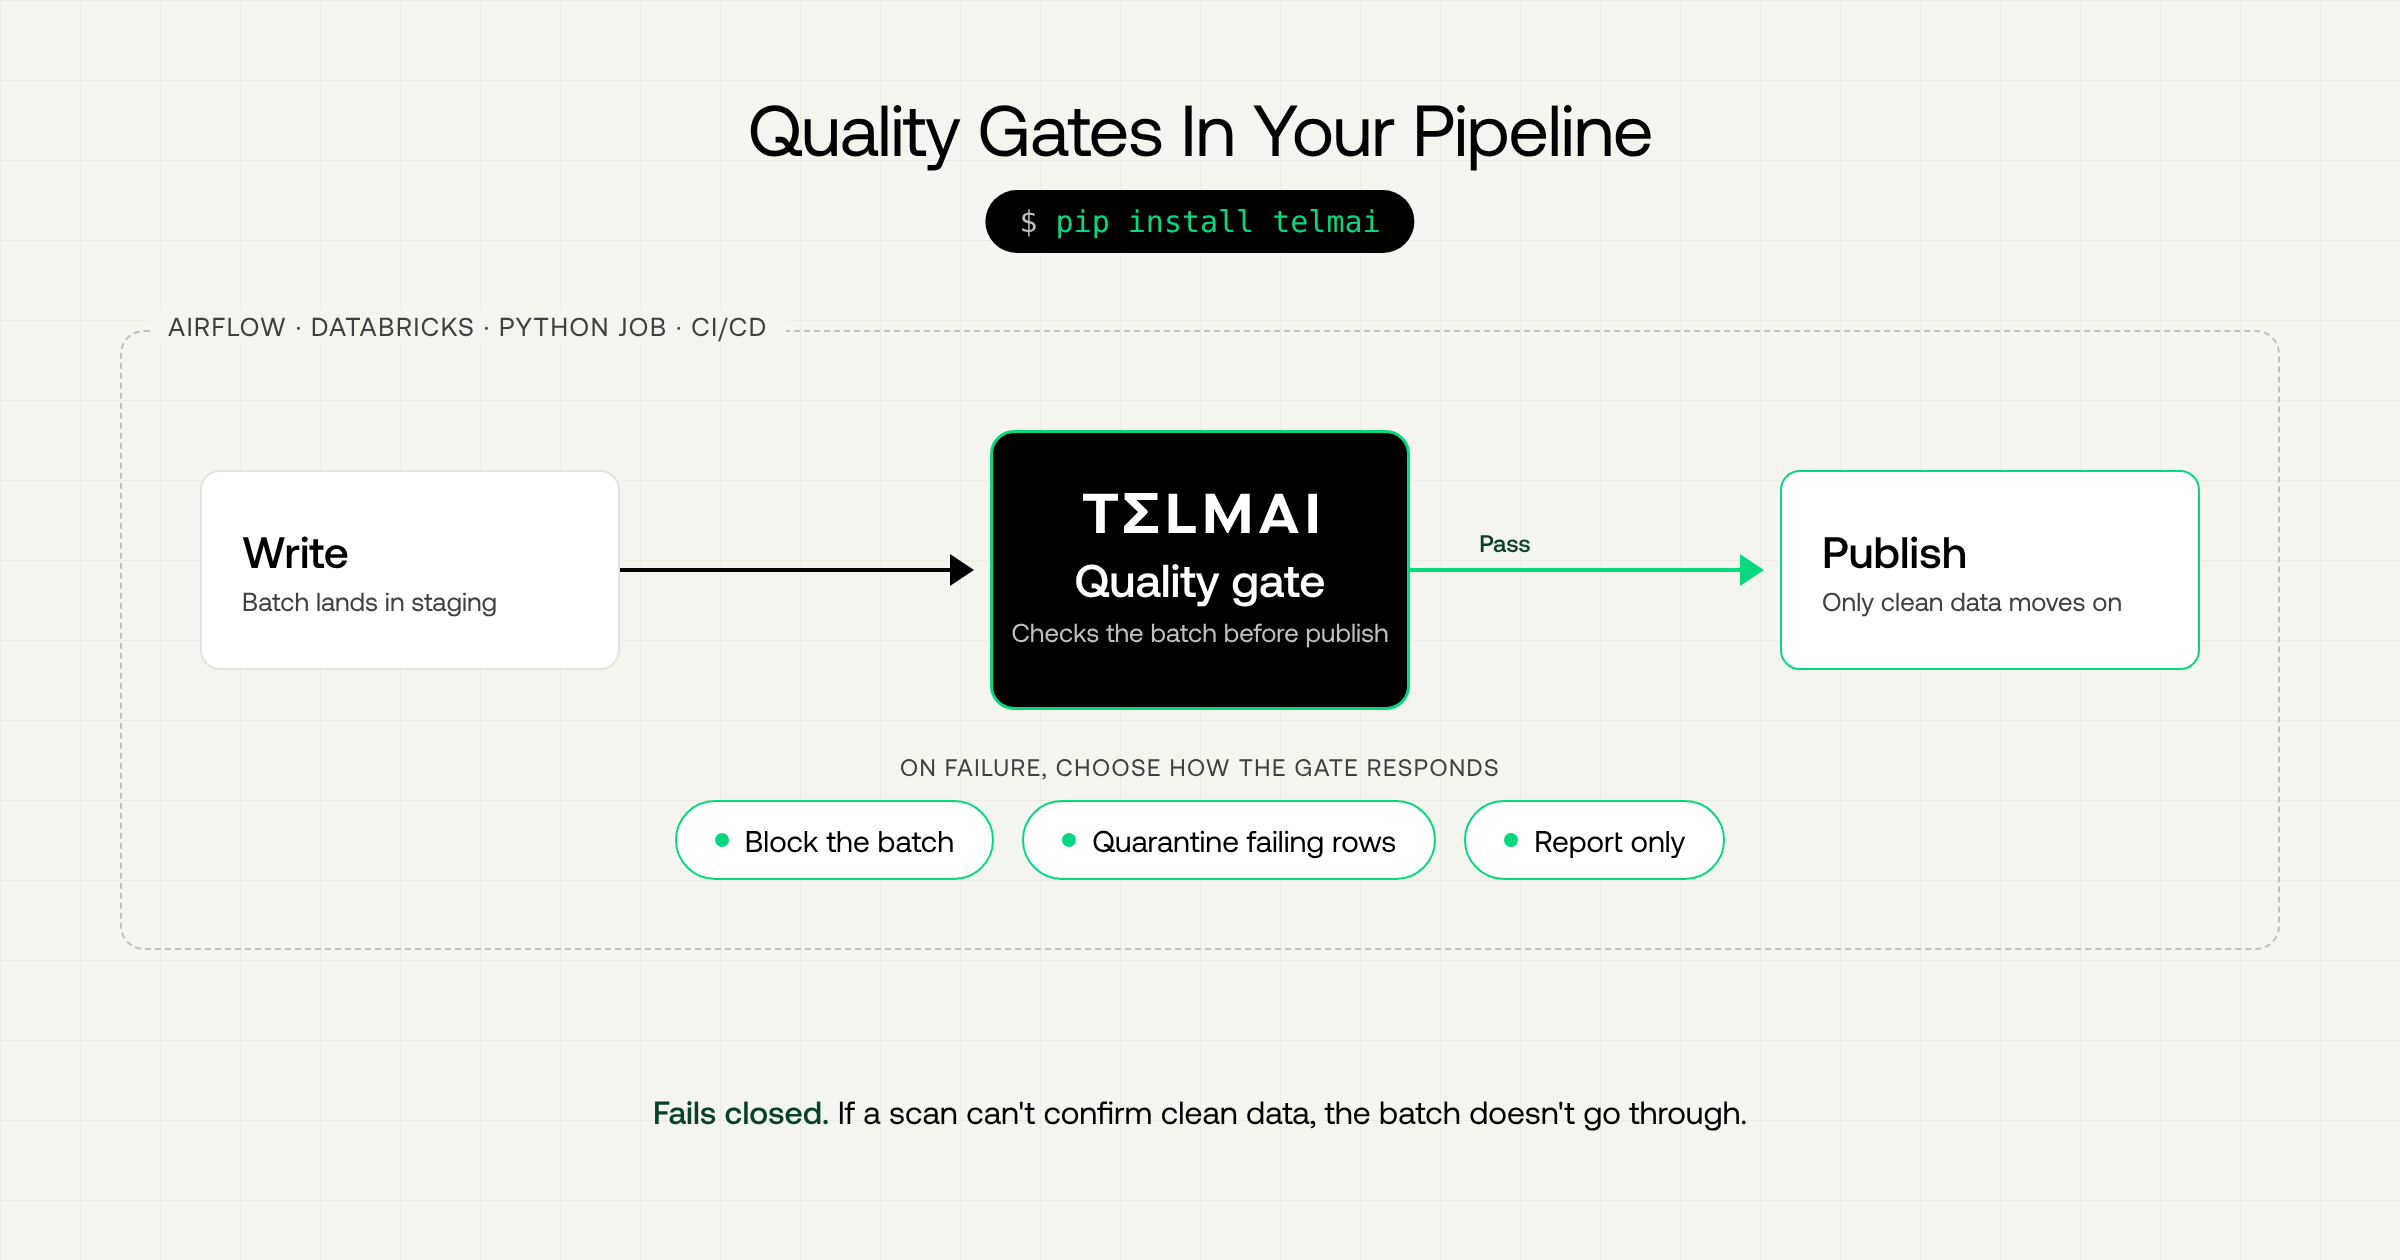
Telmai could always find bad data, but stopping it inside a pipeline meant teams writing their own API clients. The Telmai Python SDK closes that gap. A quality gate sits between the write and publish steps of an Airflow, Databricks or Python job. It can block the batch, quarantine failing rows or simply report. Gates fail closed, so a scan that can’t confirm clean data never lets the batch through, and monitors can be managed as code.
Learn more on our Python SDK page on PyPI.
See It In Action
As agents join analysts and engineers as consumers of enterprise data, trust has to travel with the data itself, through a unified context layer. Shaped by customer feedback, this release solves today’s challenges and scales with your data architecture.
Explore what’s new and tell us what you think. Your feedback shapes what we build next.
Take the product tour to explore the new experience, or book a demo with one of our experts to see Telmai in action on your domain-specific use cases.
Passionate about data quality? Subscribe to our newsletter for expert insights and guides delivered to your inbox.
- On this page
See what’s possible with Telmai
Request a demo to see the full power of Telmai’s data observability tool for yourself.