Why data freshness matters for your data pipelines?
Uncover the significance of Data Freshness in observability and its diverse forms. Learn why outdated data can be detrimental and how the frequency of table updates contributes to effective self-service. Gain insights on setting expectations and optimizing data integration.

Data freshness is crucial for maintaining data quality. Stale or Dark data can be just as harmful as incorrect data. Knowing how often your tables update helps users understand and integrate data effectively. In this blog, we’ll discuss different types of data freshness and why they matter. First, let’s explore the impact of stale or dark data.
The impact of dark and stale data
Dark data is information collected, processed, and stored but not used for any meaningful purpose. It sits in your databases, often forgotten, and can become outdated or irrelevant over time.
Let’s say you manage customer data for a retail company. Let’s take a common use case: pulling data from various customer touchpoints like purchase history, website interactions, and customer service logs into your data warehouse. This data is essential for defining customer behavior and preferences, which drive marketing strategies.
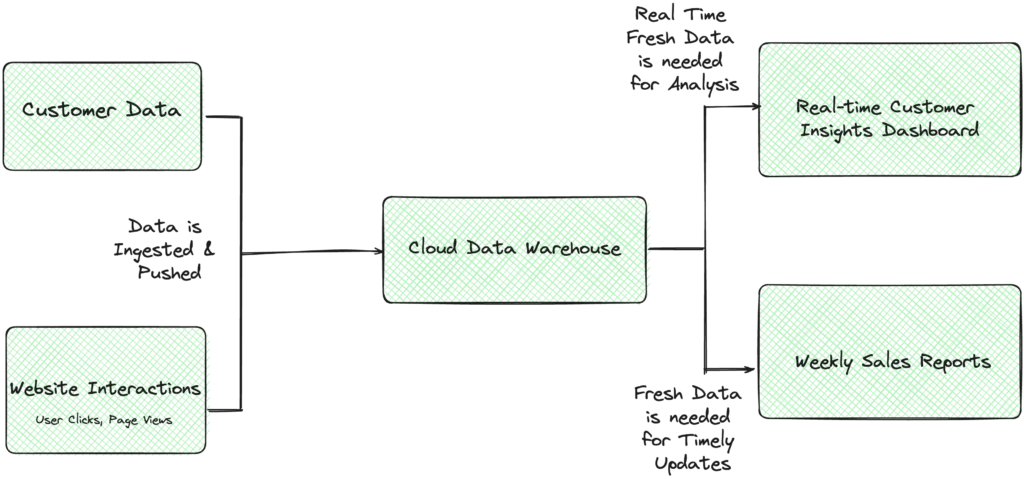
For marketing attribution, you typically need fresh data to make accurate decisions. If you’re updating this data weekly but need daily updates, the data becomes stale. This stale data can lead to ineffective marketing decisions, such as sending promotions to customers who have already made purchases, thereby wasting resources and potentially frustrating customers.
By understanding and managing data freshness, you can keep your data relevant and useful. Here are the three types of data freshness:
- Table-level Freshness: How often a table is updated and if the time since the last update is unusual.
- Record-level Freshness: The percentage of outdated records and if this percentage is growing unexpectedly.
- Entity-level Freshness: Similar to record-level but considers multiple versions of an entity in the same table.
Table-level freshness
Understanding how often a table is being updated or used serves a dual purpose
- Augmenting data catalogs with data quality insights: Understanding when the data is being updated and read is very valuable when deciding how the data can be used and integrated. For example, If data is constantly updated, it makes sense to invest in streaming integration to save on operational costs, but if the data is updated infrequently, then batch is the way to go; or even if the data is relevant at all, the table which is rarely used for querying may not be the right one even if it has the correct schema. All these considerations are critical for empowering self-service, and it’s also not uncommon to have unused legacy tables that need constant purging. These use cases collectively serve data discoverability use cases via robust data catalogs.
- Proactive monitoring and alerting: By analyzing historical trends on how often the data was delivered to a table, a system can predict the update rate, and if, for whatever reason, such an update doesn’t happen on time, it can indicate a serious issue. By proactively notifying the data pipeline owners, failures like that can be mitigated and repaired before the damage is done, and hence, this is a very valuable insight in increasing data reliability.
How to implement table level freshness?
There are different options for implementing table-level freshness. Some use database query logs to determine the write rate; others look at the last update timestamp of the table in its metadata. In contrast, some others look at the most recent timestamp within the table (in case the record update attribute is part of the schema). Each has its pros and cons, depending on the available APIs of the underlying systems.
Because query logs are different in each system and may not even be available in some, they are not ideal for defining data freshness. Therefore, a simpler option like last updated timestamp metadata would make more sense, even though it may not be as accurate.
Record-level freshness
Unlike table-level freshness, record-level freshness is related to the quality of the data itself rather than the quality of the pipeline. Table-level freshness shows us whether the pipeline delivers data but won’t tell you how much outdated data is within the table. For example, a customer may consider a record fresh and valuable if it was updated within the last month, and anything else is considered outdated. These insights can not be gathered by looking at table level freshness.
It’s crucial to monitor the percentage of outdated records, especially in the context of a data catalog. A table with 50% of outdated records may not be suitable for an accurate business intelligence report. However, it is acceptable to develop and test machine learning models. Tracking this metric and receiving alerts when the percentage unexpectedly increases is also valuable.
Entity-level freshness
Record-level freshness is a common request in data warehousing scenarios. Most modern data warehouses are designed for the high write throughput; therefore, it is a common practice to create multiple instances of the same record when updating some fields, i.e. instead of updating a record a new one is created with a newer timestamp. Deduplication, in this case, happens at a query time.
Creating additional records for every update also has the benefit of being able to look at the historical data state. That means it’s expected to have outdated records in the table. However, since multiple records belong to the same entity (ex., a customer with the same unique id has a history for every time it was updated), only the latest version of the entity needs to be analyzed for freshness. In this context, it’s better to talk of entity-level freshness rather than record-level freshness.
Supporting entity-level freshness requires implicit deduplication of the records and hence needs to be considered when building the solution.
Another consideration is that unlike table freshness, which is quickly established automatically via historical trends, entity-level freshness is tied to the business context and often requires users to provide definitions for each use case. For example, in some instances, <1 month is excellent; in others, data can’t be older than a couple of days.
In practice, record-level freshness can be calculated only if the table has an attribute – record update time:
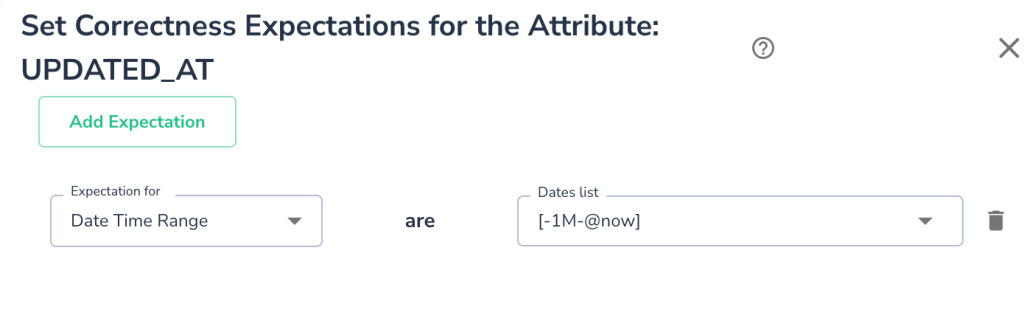
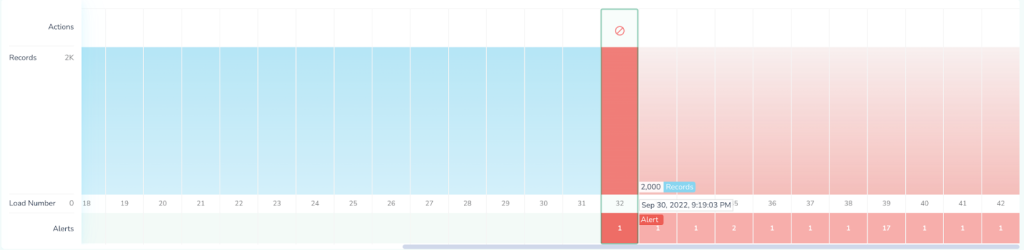
In the example above, the Freshness Expectation can be set via tools like Telmai to be no more than one month old. Telmai uses this to estimate the expected percentage of outdated records and alerts when that ratio drastically changes.
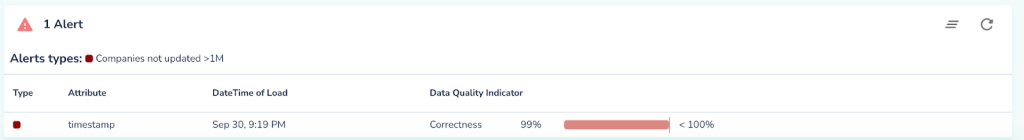
Telmai also visualizes this in a historical perspective:
Conclusion
Tracking data freshness is vital for data quality. Different levels of freshness serve different needs, from understanding update patterns to ensuring your data is reliable. At Telmai, we help you set and track freshness expectations, making sure your data stays up-to-date and useful.If you want to learn more about how we handle data freshness, click here to try Telmai today.
Passionate about data quality? Get expert insights and guides delivered straight to your inbox – click here to subscribe to our newsletter now.
- On this page
See what’s possible with Telmai
Request a demo to see the full power of Telmai’s data observability tool for yourself.