Introducing the first semi-structured data observability
Introducing Telmai’s first semi-structured data observability solution, designed to efficiently monitor data quality KPIs in modern cloud data warehouses and data lakes¹. Experience automatic trend prediction for dozens of metrics per attribute, supporting JSON, parquet, and data warehouse tables with JSON files.


Why semi-structured
As databases were evolving and migrating to the cloud, the data models were changing, too. Most modern cloud data warehouses or data lakes now support semi-structured schemas. Today, pretty much any big data platform supports working with NDJSON, i.e., New Line Delimited File, where each row is a proper JSON representing a record. And even native support of JSON schema type: [https://cloud.google.com/bigquery/docs/reference/standard-sql/json-data]
This created a great opportunity for data architects to design the most efficient data model for storage and querying. However, at the same time, it created a challenge for Data Observability. The reason is multi-value fields, aka arrays. Such data requires special logic to properly calculate basic data quality KPIs like completeness, uniqueness, etc., as there can be some records with no values vs. multiple values per record.
Example of a single record of such data:
{
“first_name”: “Jon”,
“last_name”: “Doe”,
“address”: [{
“street”:”123 Main St”,
“city”: “Neverland”,
“zip”: “94404”
}],
“phone”:[“123-124-23-45″,”124-234-3467”]
}
The data model is normally designed to make the most common queries efficient. Typically, for analytical/reporting purposes, a flatten operation (sometimes called unnest or explode) is used and is sufficient because such queries only require a single or a couple of attributes to be flattened at a time. Effectively, it means that if a record has an attribute with two values, it will get converted into two records with the corresponding value for the attribute.
In the example above, that would be:
{“first_name” : “Jon”, … , “phone” : “123-124-23-45”}
{“first_name” : “Jon”, … , “phone” : “124-234-3467”}
However, when monitoring data metrics and their drifts, such an approach becomes very inefficient, as it would require flattening and calculating aggregations one attribute at a time. In real-life cases, hundreds and even thousands of attributes are not uncommon. The accumulated overhead on each query with such an approach quickly becomes unacceptable.
Solution
Telmai is designed from the ground up to support very large semi-structured schemas. It can run with a constant number of aggregation operations (or queries) not depending on number of attributes, avoiding the overheads, and can process virtually unlimited complexity of the schema.
In the example above, Telmai extracts the following attributes and automatically predicts trends for dozens of metrics per each of them to detect unexpected drifts:
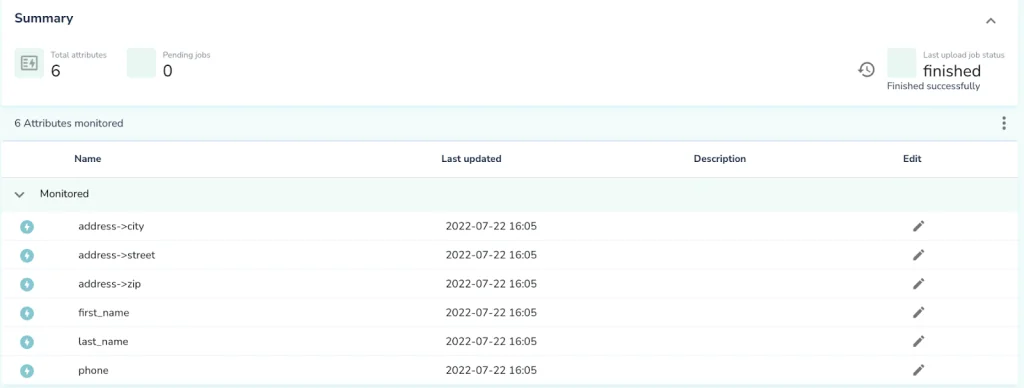
These metrics include:
- Total record count
- % of unique values
- % of incomplete/null values
- Distribution of categorical values and patterns
- Mean value frequency, length, …
- % of date, number, …
- And many more
Telmai can process semi-structured data in any form: JSON (ndjson), parquet, data warehouse tables with JSON files. For example, one of the customers expressed a need to monitor product JSON data stored in Snowflake. The challenge was that this data was of a very complex schema – a hierarchy of over 8000 attributes. Such schemas are not unique for enterprises and specifically for data describing products, as each type of a product can bring a set of attributes specific to its type. Yet, the Telmai engine was able to handle such data efficiently and give peace of mind about the quality of the data.
In summary, Telmai architecture allows the analysis of data of any volume, located anywhere (files, streams, SQL engines), and flat and semi-structured schemas of any complexity. It can also scale horizontally well, so aggressive sampling is not required either.
Passionate about data quality? Get expert insights and guides delivered straight to your inbox – click here to subscribe to our newsletter now.
- On this page
See what’s possible with Telmai
Request a demo to see the full power of Telmai’s data observability tool for yourself.


