Data pipeline testing: essential approaches, tools, and tips
Learn effective Data Pipeline testing methods with our guide on approaches, tools, and tips. Ensure your data flows seamlessly across your pipeline.

Data pipeline testing is making sure your data still looks good after it’s been poked, prodded, and passed along. From the moment it enters the pipeline till it hits its final stop, imagine a bunch of checkpoints that verify whether your data meets certain standards.
Let’s explore three smart strategies for testing your data pipelines, provide a snapshot of the best tools for the job, and talk about why you might want to consider a data observability tool to spot those sneaky issues that slip past your initial checks.
Three approaches to data testing
1. Validate the data after a pipeline has run
In this approach, tests don’t run in the intermediate stages of a data pipeline. Rather, a test solely checks if the fully processed data matches established business rules. This is the most cost-effective solution for detecting data quality issues, but running tests solely at the data destination has a set of drawbacks that range from tedious to downright disastrous.
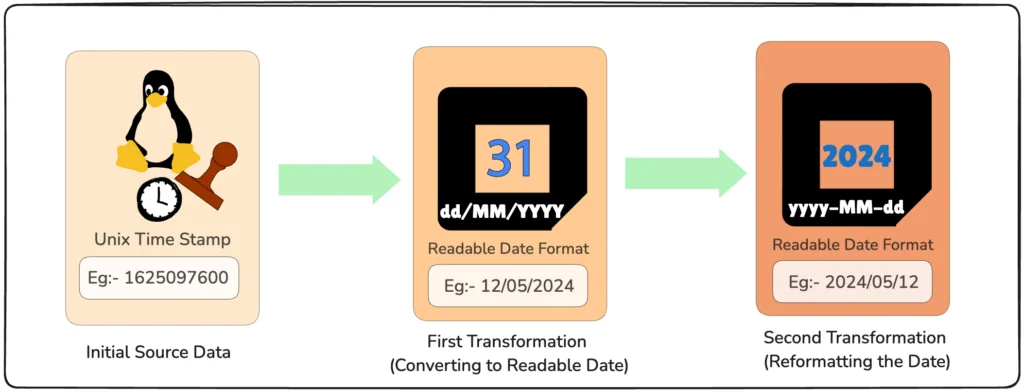
For example, imagine a transformation step that converts a Unix timestamp into a readable date format. The next step in the pipeline might involve changing the date format from dd/MM/yyyy to yyyy-MM-dd. If the first transformation incorrectly processes the timestamp—perhaps due to a bug or unexpected input—the date produced may be invalid. When the second step attempts to reformat this faulty date, it won’t recognize it and will likely throw an error, causing the entire pipeline to break down.
It’s also worth considering that there are no tests to flag the root cause of a data error, as data pipelines are more or less a black box. Consequently, debugging is challenging when something breaks or produces unexpected results.
2. Validate data from data source to destination
In this approach, the solution is to set up tests throughout the pipeline in multiple steps, often spanning various technologies and stakeholders. Although time-intensive, this approach makes tracking down any data quality issues much easier.
Be aware it can also be costly if your organization uses legacy technology (like traditional ETL tools), which doesn’t scale and requires a large team of engineers to maintain your validation rules over time. If you are moving to a modern data architecture, it is time to update your data testing and validation tools.
3. Validate data as a synthesis of the previous two
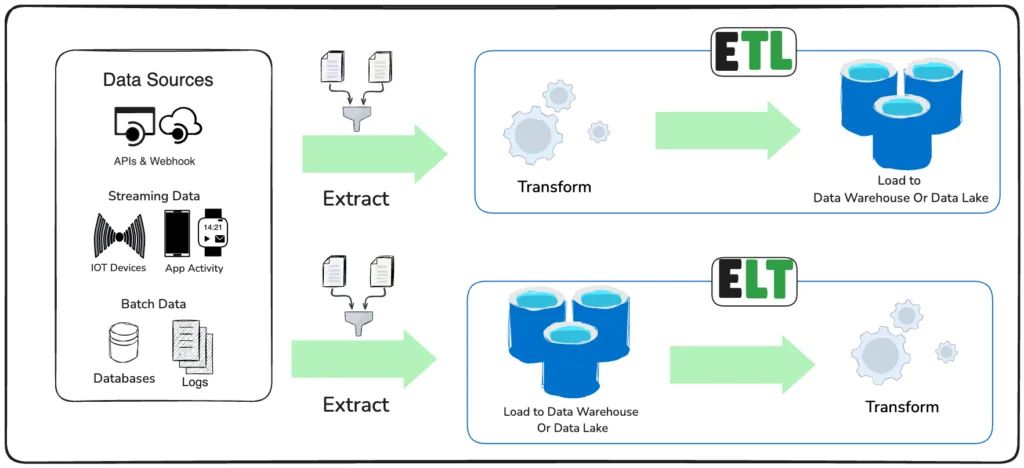
If you’re using a modern cloud-based data warehouse like BigQuery, Snowflake, or Redshift, or a data lakehouse like Delta Lake, both raw and production data exist in a single data warehouse. Consequently, the data can also be transformed in that same technology. This new paradigm, known as ELT, has led to organizations embedding tests directly in their data modeling efforts.
This ELT approach offers more benefits. First of all, data tests can be configured with a single tool. Second, it provides you the liberty of embedding data tests in the processed code or configuring them in the orchestration tool. Finally, because of this high degree of centralization of data tests, they can be set up in a declarative manner. When upstream changes occur, you don’t need to go through swaths of code to find the right place to implement new tests. On the contrary, it’s done by adding a line in a configuration file.
Essential tools for data pipeline testing
There are many ways to set up data tests. A homebrew solution would be to set up try-catch statements or assertions that check the data for certain properties. However, this isn’t standardized or resilient. That’s why many vendors have come up with scalable solutions, including dbt, Great Expectations, Soda, and Deequ. A brief overview of data testing tools:
- When you manage a modern data stack, there’s a good chance you’re also using dbt. This community darling, offered as commercial open source, has a built-in test module.
- A popular tool for implementing tests in Python is Great Expectations. It offers four different ways of implementing out-of-the-box or custom tests. Like dbt, it has an open source and commercial offering.
- Soda, another commercial open source tool, comes with testing capabilities that are in line with Great Expectations’ features. The difference is that Soda is a broader data reliability engineering solution that also encompasses data monitoring.
- When working with Spark, all your data is processed as a Spark DataFrame at some point.
- Deequ offers a simple way to implement tests and metrics on Spark DataFrames. The best thing is that it doesn’t have to process a whole data set when a test reruns. It caches the previous results and modifies it.
Enhance your data pipeline testing with data observability tools
Implementing Data Pipeline testing end-to-end can be complex. While it’s possible to manually set up testing frameworks across each step of your pipeline, many organizations find it easier to embed a data observability tool.

Telmai is a no-code data observability tool that has out-of-the-box integrations with various databases, data lakes, and data warehouses. Plug it in anywhere in your data pipeline to help you test data at ingest, in your data warehouse, and anywhere in between. Simple, fast, and SOC 2 type 2 compliant, Telmai automatically generates alerts for data drift and offers tools for rapid root cause analysis, making it easier to maintain a reliable Data Pipeline. To learn more, sign up for a free starter account.
Passionate about data quality? Get expert insights and guides delivered straight to your inbox – click here to subscribe to our newsletter now.
- On this page
See what’s possible with Telmai
Request a demo to see the full power of Telmai’s data observability tool for yourself.


