3 Open source data quality tools you can’t ignore: Great Expectations vs. Soda vs. Deequ
Each offers a cost-effective, community-backed solution, but how do they compare? Discover each tool’s key features, integrations, and limitations.

The quality of your data can dramatically impact its value, but the task of maintaining quality is increasingly daunting. Thankfully, open-source data quality tools are helping data engineers step up the fight. Three giants — Great Expectations, Soda, and Deequ — stand tall. Each offers cost-effective and community-backed solutions that safeguard the credibility of your data, but how do they compare?
Read on as each tool is evaluated according to three criteria – features, integrations, and compatibility with existing pipeline architecture – to help you make the best choice.
Great Expectations
Great Expectations (GX) is a Python-based open-source tool for managing data quality. It provides data teams with the ability to profile, test, and create reports on data. The tool features a user-friendly command-line interface (CLI), making it easy to set up new tests and customize existing reports.
Great Expectations can be integrated with a variety of extract, transform, and load (ETL) tools such as Airflow and databases.
Key features
1. Expectations
Expectations are assertions about your data. In Great Expectations, those assertions are expressed in declarative language in the form of simple, human-readable Python methods. Great Expectations has lots of predefined expectations that you can find here, but you can also define your expectations.
2. Automated data profiling
Great Expectations profiles your data to get basic statistics and automatically generates a suite of Expectations based on what is observed in the data.
For example, using the profiler on a column passenger_count that only contains integer values between 1 and 6, Great Expectations automatically generates this Expectation we’ve already seen:
expect_column_values_to_be_between(column=”passenger_count”,min_value=1,max_value=6)3. Data validation
Once you’ve created your Expectations, Great Expectations can load any batch or several batches of data to validate with your suite of Expectations. Great Expectations tells you whether each Expectation in an Expectation Suite passes or fails and returns any unexpected values that failed a test.
4. Data Docs
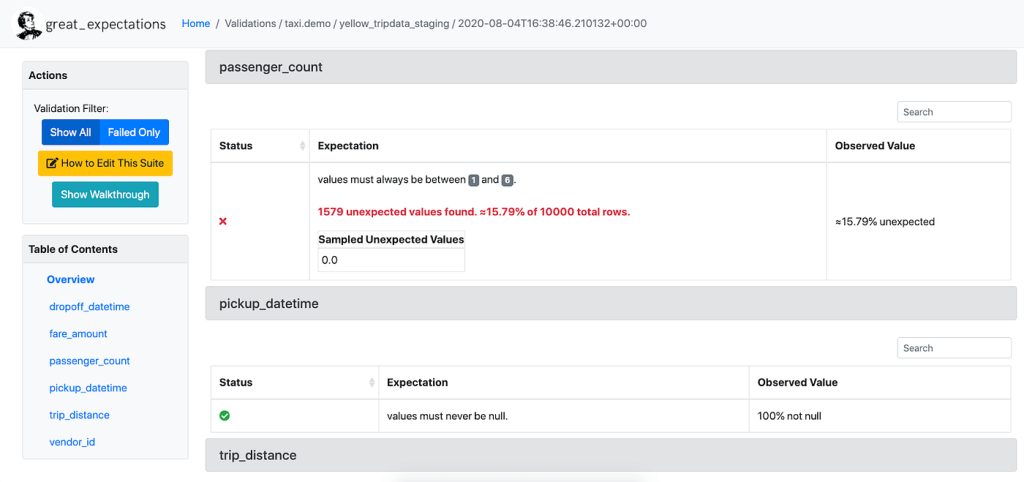
Great Expectations renders Expectations in a clean, human-readable format called Data Docs. These HTML docs contain both your Expectation Suites and your data Validation Results each time validation is run — think of it as a continuously updated data quality report. The following image shows a sample Data Doc:

Here is a blog post about how to use Great Expectations for the data quality metrics, including completeness, uniqueness, timeliness, validity, consistency, and integrity.
Integrations
You can find the tools and systems that Great Expectations support here. Please note that Great Expectations currently only supports AWS Glue for data integration, but they support a lot of other data sources and orchestrators (it works fairly well with Airflow from my own experience).
Limitations
- It can be challenging to scale when dealing with large amounts of data. Processing massive datasets can put a strain on system resources and may lead to performance issues or scalability constraints.
- One major feedback from the developers is that the documentation is too complex and it is hard to get started.
Soda Core
Another open-source application that offers the functionality required to guarantee data validity is Soda Core. As with Great Expectations, the tool itself is built in Python, but it approaches data validation in a different way. Simply delivering a set of YAML configuration files that instruct Soda how to connect to your data warehouse and what tests you want to run on your various tables is all that is required of you as a developer.
When managing hundreds of tables with various owners and maintainers, this method scales quite well. Since the introduction of SodaCL, you may use loops and special Soda syntax within the YAML configuration to improve how you create the metrics and checks. Initially, Soda required one YAML file per table.
Soda also provides a robust Python library, which opens the door to customized usage and using the output of its checks directly within a Python program. Soda primarily prioritizes CLI interactions to execute the checks (with a wide range of commands and settings).
Key features
1: SodaCL
Soda Checks Language (SodaCL) is a YAML-based, domain-specific language for data reliability. Used in conjunction with the Soda platform, you use SodaCL to write checks for data quality and then run a scan of the data in your data source to execute those checks. Refer to this documentation for examples of yml configurations of your data pipeline.
2. Soda Check
A Soda Check is a test that Soda Core performs when it scans a dataset in your data source. The checks YAML file stores the Soda Checks you write using SodaCL. For example, you can define checks that look for things like missing or forbidden columns in a dataset or rows that contain data in an invalid format. See here for more details.
Below are the sample codes for a soda check:
# Checks for basic validations
checks for dim_customer:
- row_count between 10 and 1000
- missing_count(birth_date) = 0
- invalid_percent(phone) < 1 %:
valid format: phone number - invalid_count(number_cars_owned) = 0:
valid min: 1
valid max: 6
- duplicate_count(phone) = 0
3. Soda Scan
A Soda Scan executes the checks you defined in the checks YAML file and returns a result for each check: pass, fail, or error. You can refer to this article for details about code examples. Below are example outputs for running a Soda Scan.
Example output with a check that triggered a warning:
Soda Core 0.0.x
Scan summary:
1/1 check WARNED:
CUSTOMERS in postgres_retail
schema [WARNED]
missing_column_names = [sombrero]
schema_measured = [geography_key, customer_alternate_key, title, first_name, last_name ...
Only 1 warning. 0 failure. 0 errors. 0 pass.
Example output with a check that failed:
Soda Core 0.0.x
Scan summary:
1/1 check FAILED:
CUSTOMERS in postgres_retail
freshness(full_date_alternate_key) < 3d [FAILED]
max_column_timestamp: 2020-06-24 00:04:10+00:00
max_column_timestamp_utc: 2020-06-24 00:04:10+00:00
now_variable_name: NOW
now_timestamp: 2022-03-10T16:30:12.608845
now_timestamp_utc: 2022-03-10 16:30:12.608845+00:00
freshness: 624 days, 16:26:02.608845
Oops! 1 failures. 0 warnings. 0 errors. 0 pass.
Integrations
Soda supports a wide range of integrations with data sources, integrations, orchestration tools and infrastructures. See here for a list of data sources and platforms that Soda supports. Below are the packages it comes with for integrations:
- soda-core-athena
- soda-core-bigquery
- soda-core-db2
- soda-core-postgres
- soda-core-redshift
- soda-core-snowflake
- soda-core-spark-df
- soda-core-sqlserver
- soda-core-mysql
- soda-core-trino
Limitations
- One limitation is that Soda’s functionality is primarily focused on SQL-based data sources. If you are working with non-SQL or NoSQL data stores, such as MongoDB or Elasticsearch, Soda might not be the most suitable option.
- Another limitation is that Soda might not provide as extensive support for complex data quality rules and transformations compared to some other data quality tools. If you require advanced data profiling, complex rule validation, or custom data quality checks beyond SQL-based queries, you might find Soda’s capabilities somewhat limited.
Deequ
Deequ is a library built on top of Apache Spark for defining “unit tests for data”, which measure data quality in large datasets. Deequ depends on Java 8. Deequ version 2.x only runs with Spark 3.1, and vice versa.
Features
1. Metrics computation
Deequ computes data quality metrics, that is, statistics such as completeness, maximum, or correlation. Deequ uses Spark to read from sources such as Amazon S3, and to compute metrics through an optimized set of aggregation queries. You have direct access to the raw metrics computed on the data.
In the following example, we show how to use the AnalysisRunner to define the metrics you are interested in.
import com.amazon.deequ.analyzers.runners.{AnalysisRunner, AnalyzerContext}
import com.amazon.deequ.analyzers.runners.AnalyzerContext.successMetricsAsDataFrame
import com.amazon.deequ.analyzers.{Compliance, Correlation, Size, Completeness, Mean, ApproxCountDistinct}val analysisResult: AnalyzerContext = { AnalysisRunner
 // data to run the analysis on
 .onData(dataset)
 // define analyzers that compute metrics
 .addAnalyzer(Size())
 .addAnalyzer(Completeness("review_id"))
 .addAnalyzer(ApproxCountDistinct("review_id"))
 .addAnalyzer(Mean("star_rating"))
 .addAnalyzer(Compliance("top star_rating", "star_rating >= 4.0"))
 .addAnalyzer(Correlation("total_votes", "star_rating"))
 .addAnalyzer(Correlation("total_votes", "helpful_votes"))
 // compute metrics
 .run()
}
2. Constraint verification
As a user, you focus on defining a set of data quality constraints to be verified. Deequ takes care of deriving the required set of metrics to be computed on the data. Deequ generates a data quality report, which contains the result of the constraint verification.
3. Constraint suggestion
You can choose to define your own custom data quality constraints, or use the automated constraint suggestion methods that profile the data to infer useful constraints.
4. Data validation on incremental data
Deequ also provides a way to validate incremental data loads. You can read more about this approach here.
5. Anomaly detection
Deequ also provided an approach to detect anomalies. The GitHub page lists down some approaches and strategies. Details can be found here.
Integrations
Deequ works on tabular data, e.g., CSV files, database tables, logs, flattened json files, basically anything that you can fit into a Spark dataframe.
Limitations
- Labor intensive: Deequ requires a deep analysis and understanding of the underlying behavior of each dataset. Consulting subject matter experts is crucial to determine the appropriate rules to be implemented. Additionally, rules need to be implemented for each bucket in the S3 Data Lake, resulting in effort that is linearly proportional to the number of buckets.
- Incomplete Rules Coverage: Users must predict everything that could go wrong and write rules for it. The quality of rules coverage is non-standard and user-dependent.
Worried open source isn’t enough? It’s time to try Telmai
All three of these open-source tools offer a compelling foray into the world of data quality monitoring, but if (or really, when) your pipelines transcend the capabilities of open-source, a more comprehensive solution may be needed.
This is where a data observability platform like Telmai comes into play.
Data observability provides full visibility into the entire data lifecycle – from ingestion to transformation and consumption. What makes Telmai special is that you can do all this without writing a single line of code.
Telmai revolutionizes data quality management by offering integrations to over 250+ systems, including open table formats like Apache Iceberg with a no-code setup.

Telmai learns automatically from your data and alerts users to unexpected drifts, including changes in row counts, schema changes, and unusual variations in value distribution. Beyond its alerting capabilities, Telmai equips users with advanced investigative tools to quickly identify the root cause of data issues, providing visual cues on value distributions, pattern masks, and anomaly scores. Plus, customizable alerting policies allow you to fine-tune alerts based on your specific business needs, ensuring that you’re notified the moment your data quality deviates from your expectations.

Through automated remediation workflows, such as data quality binning, Telmai classifies and isolates anomalous data for further investigation, accelerating resolution times and ensuring continuous flow of reliable data.
Don’t just manage your data quality, master it with Telmai. Request a demo today to experience the transformative power of data observability.
Passionate about data quality? Get expert insights and guides delivered straight to your inbox – click here to subscribe to our newsletter now.
- On this page
See what’s possible with Telmai
Request a demo to see the full power of Telmai’s data observability tool for yourself.