Data quality key performance indicators
Did you know that there is no standardization of the names or even agreement as to how many dimensions of data quality there are? That said, we think you’ll agree that these six widely used dimensions are a good starting point.


A chef preparing a gourmet meal might use a thermometer to check the temperature of the meat. A mechanic working on a car might use a dipstick to check the engine’s oil level. For data teams, how do we specify data quality, and how do we measure it?
Data quality is more important than ever, but as technology evolves, the way we talk about data quality is struggling to keep up.
Historically many data quality dimensions have been adopted, like Accuracy, Validity, Completeness, Consistency, Reliability, Timeliness, Uniqueness, Accessibility, Confidentiality, Relevance, Integrity, … etc.
However, there is no standardization of their names or descriptions.
A comprehensive survey of over 60 dimensions was conducted by DAMA NL Foundations and published in DDQ-Research-2020 as an attempt to move towards more standardization. Among the many dimensions of data quality, customers typically choose a small subset of the most critical ones for their needs.
These are referred to as the primary or critical dimensions.
Although the primary dimensions are not universally agreed on, even amongst data quality professionals, six dimensions are widely accepted as primary dimensions:
This blog post focuses on these six widely used dimensions and their measurements, which we refer to as data quality indicators (DQI).
Completeness
One of the most basic but crucial indicators of data quality is completeness, often defined as not-null values.
So, complete compared to what? Since data is populated at different levels, there’s different ways to calculate this.
- Dataset/Database: Total data present across all the tables in the entire dataset or database. Expected values are usually calculated against historical data or against other data sources in the pipeline.
- Table/schema: Total data populated in specific tables like Customers, Orders, or Transactions. Expected values are usually calculated against historical data or against other data sources in the pipeline.
- Metadata: The degree to which both technical and business metadata information is populated. This is usually measured as not-null values for metadata like descriptions, security tags, creation date, etc. in your data catalog.
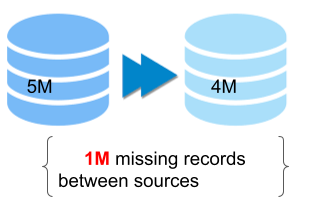
- Records: Total number records in the dataset. Expected values can be measured against historic trends or lineage across various data sources in the pipeline. For example, based on historical trends, users expect 1M records but receive only 500k, causing incomplete records. Or BigQuery has 1M records whereas Cassandra has only 800k records, indicating the records are incomplete.
- Attributes: Total number of attributes in a schema definition. Expected values can be specified by business requirements. This is a useful indicator to ensure schema is complete across multiple data sources in your data pipeline and can be tracked through lineage of schema. For Example, the Customers table in BigQuery has 18 attributes, whereas Cassandra has only 16 attributes; often classified as schema mismatch too.
- Value: Total numbers of populated attribute values across all rows. For example, if a table has 10 rows with 5 attributes, this will indicate how many values are populated across these 50 values.
- An attribute value: Total numbers of populated attribute values for a specific attribute.
Completeness can be calculated using simple null checks at your datastore level. Data is populated with values that exclude the template/null proxies. Examples of null proxies would be 000-000-000, N/A, none, not-defined, Not-applicable , and NA.
The standard unit of measure is percentage(%).
For example, the Customers table of 3M customers has 2.94M populated emails.
Then the completeness of emails is 2.94/3 x 100 = 98%.
Uniqueness
The percentage of records that can be identified uniquely based on a predefined key is its uniqueness.
Assuming your table has a primary key defined, the formula for measuring uniqueness would be:
1 – primary_key_count / total_row_count
⚠️ Good to know: Uniqueness is the inverse of duplicates
Here are a few examples of how uniqueness can affect data quality:
Duplicate with identical key values
One record with one key value occurs more than once in a dataset. The two records are not unique.
Oftentimes datastore constraints can easily help avoid this issue.
Duplicate with different key values
Multiple records with the same values occur more than once in a dataset. Object John is not unique in the dataset.
| Key | Student Name |
|---|---|
| 22 | John Snow |
| 22 | John Snow |
False duplicate
A record has the same key as another record, and both occur in a dataset. Key 22 is not unique.
| Key | Student Name |
|---|---|
| 22 | John Snow |
| 27 | John Snow |
Most often users will need to use sophisticated master data management and Identify resolution systems for resolving duplicates like these.
Freshness
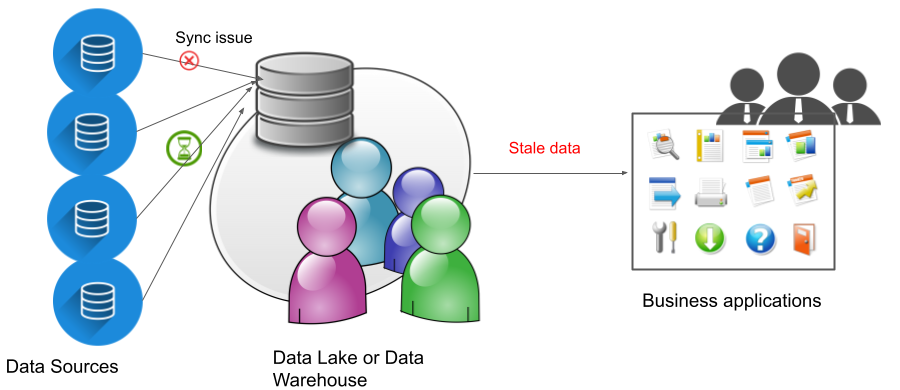
Freshness is the delay after which data is considered complete. Data is fresh when it is up-to-date and available on time.
Conversely, data is not fresh when it is stale and unreliable.
Freshness can be associated with various levels including metadata. Is the metadata available and up to date at the time someone is attempting to use it to understand the data that he or she is accessing?
You measure freshness by the length of time between data availability and time of the event or phenomenon they describe.
While many think of freshness as a simple metric, it has several layers, namely table-level freshness, record-level freshness, and finally entity-level freshness.
Validity
For data to be valid, it should be collected according to predefined rules and parameters, and should conform to the right format and be within the right range.
For example, if the data is dates and needs to be in DD-MM-YYYY format, but the data is in MM-DD-YY format, then it’s invalid.
Data could also be invalid if it doesn’t conform to defined business rules. For example, if cancelation date > travel date
All data can typically be measured for validity. Validity applies at the data item level, record level (for combinations of valid values), as well as metadata.
It’s typically measured as the percentage of data items valid.
Note that data may also be valid only for a specific length of time. For example, data that is generated from RFID or scientific datasets.
Accuracy
As one of the most complex yet critical data quality indicators, accuracy is the degree to which the data item correctly describes the “real world” object or event being described.
Specifications of the “real world” are usually based on business context.
Accuracy can be associated with various levels including metadata. Is the metadata from a verifiable source, and does it describe the data it is attached to correctly? For example, if the metadata is a definition, does the definition correctly define the data element in question?
You measure accuracy by the degree to which the data mirrors the characteristics of the real world object or objects it represents. The higher the percentage of data entries that pass the data accuracy rules, the more accurate your data is.
Here’s an example of data accuracy: A European school is receiving applications for its annual September intake and requires students to be aged 5 before the 31st August of the intake year.
In this scenario, the parent, a US citizen, applying to a European school completes the Date of Birth (D.O.B) on the application form in the US date format, MM/DD/YYYY rather than the European DD/MM/YYYY format, causing the representation of days and months to be reversed.
As a result, 09/08/YYYY really meant 08/09/YYYY causing the student to be accepted at the age of 5 on the 31st August in YYYY.
The representation of the student’s D.O.B.–whilst valid in its US context–means that in Europe the age was not derived correctly and the value recorded was consequently not accurate.
Consistency
Consistency can refer to ensuring that data values are consistently represented within a dataset and between datasets, and consistently associated across datasets. Or the degree to which data values of two sets of attributes within a record comply with a rule. Or the degree to which the data values of a set of attributes of a dataset at different points in time comply with a rule.
In consistency two or more data values are compared.
There are various types of consistency:
- Consistency within a record: The degree to which data values of two sets of attributes within a record comply with a rule.
- Consistency between records within a dataset: The degree to which data values of two sets of attributes between records comply with a rule.
- Consistency across datasets: The degree to which data values of two sets of attributes between datasets comply with a rule.
- Consistency over time (temporal consistency): The degree to which the data values of a set of attributes of a dataset at different points in time comply with a rule.
- Consistency across metadata: Is all the metadata consistent, or does it conflict with other metadata? For example, does a usage business rule demand that data be used when the creation business rules state it hasn’t been created yet? Plausibility of data values can be seen of a type of consistency.
A rule can be an equation with a =, > or < symbol. For example, profit = return – costs.
A rule can also be a business rule. For example, one might expect that the number of transactions each day does not exceed 105% of the running average number of transactions for the previous 30 days.
A data item could be measured against itself or its counterpart in another dataset or database.
An example of data consistency would be whether a student’s date of birth has the same value and format in the school register as that stored within the Student database.
Consistency is often measured as a percentage.
Do not confuse consistency with accuracy or correctness.
A note about data lineage
While data lineage is not an indicator of data quality, and therefore not elaborated on in this blog, it is a way to get to the root cause of data quality issues. We explain further in our blog post How important is Data lineage in the context of Data Observability?
Next step: develop thresholds and alerting policies based on these six data quality indicators
As the state of data changes, it’s critical not to be caught on the back foot.
Observe, capture, and stay alert to changes in your data with Telmai, the no-code data observability tool for the entire modern data stack. Telmai not only has these six primary data quality indicators, but 40+ predefined data metrics that you can leverage immediately, making rollout of a data monitoring quick and painless.
Passionate about data quality? Get expert insights and guides delivered straight to your inbox – click here to subscribe to our newsletter now.
- On this page
See what’s possible with Telmai
Request a demo to see the full power of Telmai’s data observability tool for yourself.
Articles
See all articles


