5 Reasons to consider centralized data observability for your modern data stack
Explore the importance of centralized data observability in the modern data stack. Learn how it enhances execution speed, reduces engineering costs, and ensures data reliability. Discover five compelling reasons to implement this critical component in your data infrastructure.


As organizations sprint towards modernizing their data stacks, they aim to enhance operational efficiency and reduce engineering costs. There’s also a growing emphasis on ensuring the readiness of their data for AI applications.
Centralized Data Observability and Data Quality are critical components in developing and operationalizing AI models to achieve optimal performance.
In this article, we explore five key reasons for considering centralized data observability in your Data Ecosystem. First, let’s understand what defines centralized data observability.
What is centralized data observability?

A centralized data observability monitors data across the entire data pipeline, from ingestion to consumption. It not only supports structured and semi-structured data across various systems such as data warehouses, data lakes, message queues, and streaming sources, but it can also support all the common data formats like JSON, CSV, and parquet.
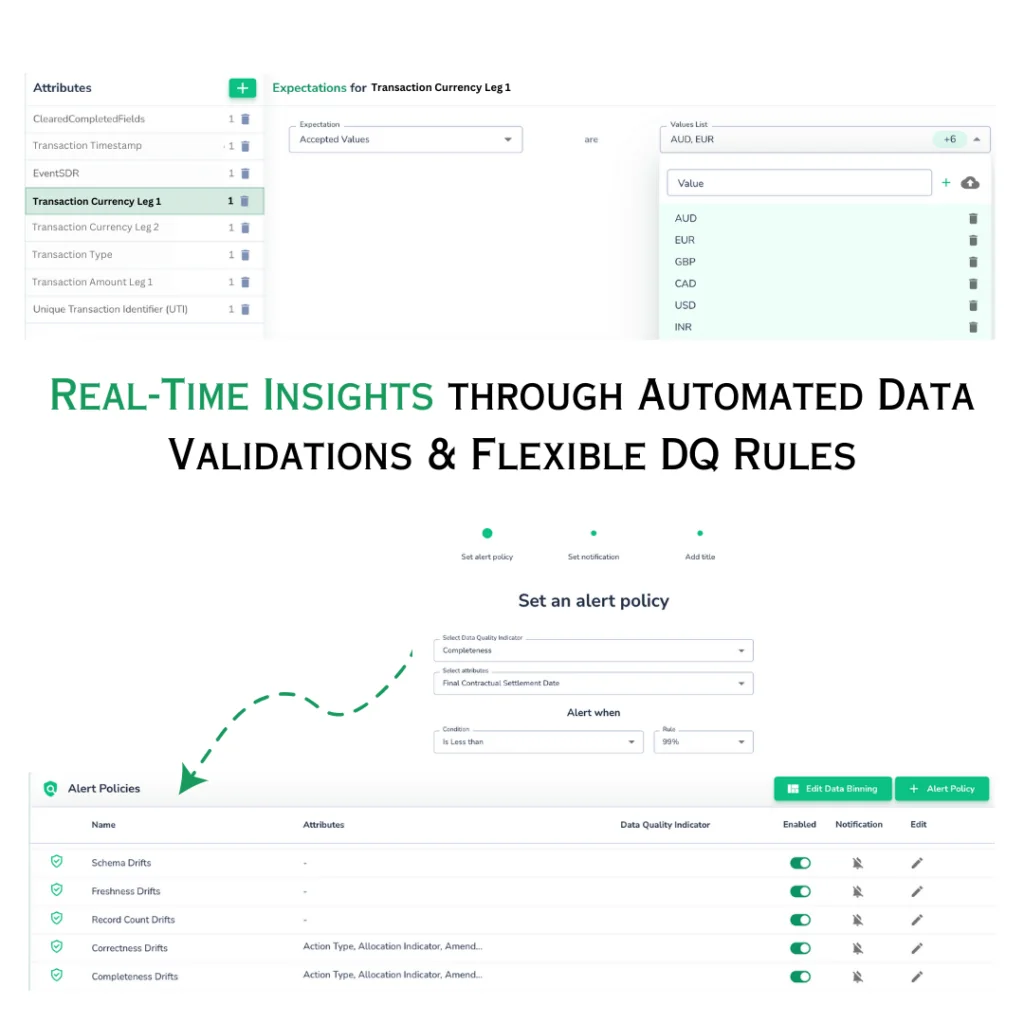
A centralized data observability platform enables users to define Data Quality Key Performance Indicators (KPIs) like Completeness, Uniqueness, Accuracy, Validity, and Freshness across the entire DataOps system. This platform serves as a unified space to view, manage, and monitor these KPIs.
Why do modern data stacks need centralized data observability?
Although various approaches to data observability exist and the vendor landscape has become quite popular, Centralized Data Observability platforms stand out as the most suitable solution for modern and evolving data stacks. Here are five core reasons:
1. Replacing redundant data quality efforts with automation and ML
Traditionally, teams have used individual rules or queries to assess data health, which has led to inefficiencies and increased infrastructure costs due to the accumulation of queries over time.
The shift to a modern data stack highlights a critical insight: the diminishing tolerance for repetitive tasks since data engineering resources are stretched thin across numerous tools to integrate legacy systems and upkeep existing infrastructures.
Automation and self-maintained platforms are phasing out traditional methods and legacy systems. A centralized data observability platform automates the oversight of data throughout its journey, eliminating the need for manual code writing for checks at every data transformation stage. This approach streamlines operations and ensures your peace of mind with proactive alerts and background monitoring.
2. Supporting all new data types – structured or semi-structured
As we have seen with emerging technologies such as data streaming and reverse ETL, data is constantly sourced and activated across various shapes and formats. While many data observability platforms can monitor structured data, such as data warehouses or databases, they cannot monitor data that doesn’t have well-defined metadata.
A centralized data observability tool can monitor and detect issues and anomalies in all data types, including structured and semi-structured sources. Because this platform relies on data patterns and not just metadata, centralized observability is flexible to observe data across various systems without forcing the data to be shaped into a structured format before it can be observed.
3. Running data observability at every step of the pipeline
Historically, data pipelines were straightforward, focusing on ETL processes that cleaned and transformed data from legacy databases into normalized formats suitable for BI operations. Today, data pipelines are ingesting mixed-type data into data lakes and using modern transformation and in-database processes to shape the data. With the rise of delta lakes and cloud data warehouses as central information hubs, modern data science projects adapt feature engineering and feature stores.
Point data observability tools are often built for data warehouse monitoring or data science and AIOps. They are good systems for monitoring a data pipeline’s landing zone or the last mile. Still, for the data that moves through numerous hops and stops, a centralized data observability platform is crucial to monitor the data at every step of the pipeline: at ingest to detect source system issues, at the transformation point to ensure ETL jobs are performed correctly, at the data warehouse or consumption layer to detect any anomalies or drift in business KPIs.
4. Creating a central understanding of data metrics across data teams
With metric formulas scattered across BI tools and buried in dashboards, the industry recognized the need for a dedicated metrics layer. This layer aims to stop the cycle of recreating and rewriting KPIs for each dashboard, offering a centralized space for sharing, reusing, and collaborating on KPI definitions. It serves to unify key business metrics, enhancing data teams’ efficiency. Yet, it falls short of verifying the accuracy of these metrics.
Deploying a centralized data observability platform atop this metrics layer ensures the commonly used metrics adhere to quality standards. The concept of reusability hinges on the availability of high-quality, reusable components. Thus, ensuring metric quality is as crucial as centralizing the metrics themselves.
5. Ability to change the underlying data stack without impacting observability
Reflecting on the rapid innovation within the data space, Teams are transitioning to a modern stack, and the days of SQL interfaces on Hadoop are numbered. With the emergence of new technologies and ML-driven applications, each addressing specific challenges, the pace of change will only accelerate.
Relying on a Data Observability platform tied to a particular system’s specific metadata and logs poses challenges when transitioning to new systems or integrating additional ones into your pipeline. Constantly revising data quality definitions with each system change is inefficient. Instead, your Data Observability solution should seamlessly adapt to changes in your stack. A centralized Data Observability platform offers this adaptability. It operates independently of the systems it monitors, employing its computation engine for metrics analysis, thus eliminating dependency on the metadata or SQL dialects of individual data stores.
Closing thoughts
As modern data stacks continue to evolve and gain popularity, the significance of data observability within these complex ecosystems has never been more critical.
Simple measures such as checks and balances, pre-defined rules, and basic metadata monitoring were adequate in the past. However, today’s data pipelines have become complex, incorporating numerous systems and platforms to enhance data capture and usability.

This is where a centralized data observability platform like Telmai stands out. Telmai doesn’t just offer standard data observability solutions; it excels by ensuring accuracy and reliability in your data, embodying excellence in execution. Unlike other platforms that reactively correct data anomalies, Telmai proactively identifies and isolates issues early on, ensuring the data flowing through your systems is accurate and consistently dependable.
With Telmai, you’re not just maintaining data quality but mastering it. Click here to take a quick product tour now.
Passionate about data quality? Get expert insights and guides delivered straight to your inbox – click here to subscribe to our newsletter now.
- On this page
See what’s possible with Telmai
Request a demo to see the full power of Telmai’s data observability tool for yourself.


