DataStax builds trust in product usage data with Telmai
Fully automated data observability empowers trust in product usage data across 36,000 clusters.
Overview
DataStax is a real-time data company. DataStax helps enterprises mobilize real-time data and quickly build the smart, high-scale applications required to become data-driven businesses. As a result, product operations, reliability, performance, and availability are of the highest priority for DataStax. A leading indicator of their product health is strong and growing product adoption and usage. To monitor and report on usage, DataStax initially built a homegrown solution.
The DataOps team at DataStax is on a mission to create centralized Data insights, empowering all internal marketing, sales, customer success, product, and leadership teams with accurate and trustworthy product usage reports and analytics. The team initially built their data quality in-house, but with the high growth of customers and new clusters spinning up rapidly, they wanted to automate and scale their data quality engines fast.
Key Benefits
High quality data that feeds business KPIs on product usage metrics
Higher trust in data for business teams and the leadership staff
Detecting unknown issues before they become real issues
Ability to observe data at scale without growing headcount
The challenge: Ever-increasing number of customers and new self-service users created a more significant demand for high-quality usage data
With a growing number of customers and the strategic nature of their cloud offering, DataStax has an extremely high bar for data quality, and this includes the quality of product analytics data that is used for decision-making.
DataStax’s product usage analytics is collected from their database logs. DataStax’s data engineering team – led by Ankush Gautam – uses Python, DBT, and SQL to transform the data from log files into Google BigQuery tables. Tableau is then used for analytics and reporting.
Even with a strong data quality framework in place, SQL and Python data pipelines that read and transform log data into analytic-ready datasets were still prone to sporadic and unexpected issues. Any change in the upstream data transformation or the log data itself could create unexpected outliers in reporting and the metrics associated with it.
One example of this was read operations. If the usage reports showed that read operations on a cluster had gone down, the team could not truly tell whether the actual usage had dropped or the data pipelines that parse and pull the log information did not correctly deliver the data into Google BigQuery tables. In other words, the team could not tell whether low usage was a true or a false positive ––an accurate indicator of customer abandonment or purely a pipeline failure where the data wasn’t delivered correctly and, therefore, it just needed to be fixed. Other data quality issues occurred in monitoring and tracking the number of write operations, the number of users with no activity in the last 3 days, and the usage growth in major account clusters.
To ensure accuracy, the team investigated their pipelines further, which added an unwanted overhead
In investigating these reporting issues, DataStax realized that monitoring the pipelines and ensuring successful job runs to ensure a healthy infrastructure, but could lead to misleading information. In some cases, jobs may run successfully, but multiple times and end up duplicating the reporting data. In other cases, some jobs with successful completion status move the data to the reporting layer, but only partially.
With these discoveries, DataStax learned that they could not solely rely on the volume or count of records in their reporting tables to show usage growth, and similarly, they could not rely on job statuses to trust the data at hand. Because of these reasons, the team implemented additional health checks to spot-check data values.
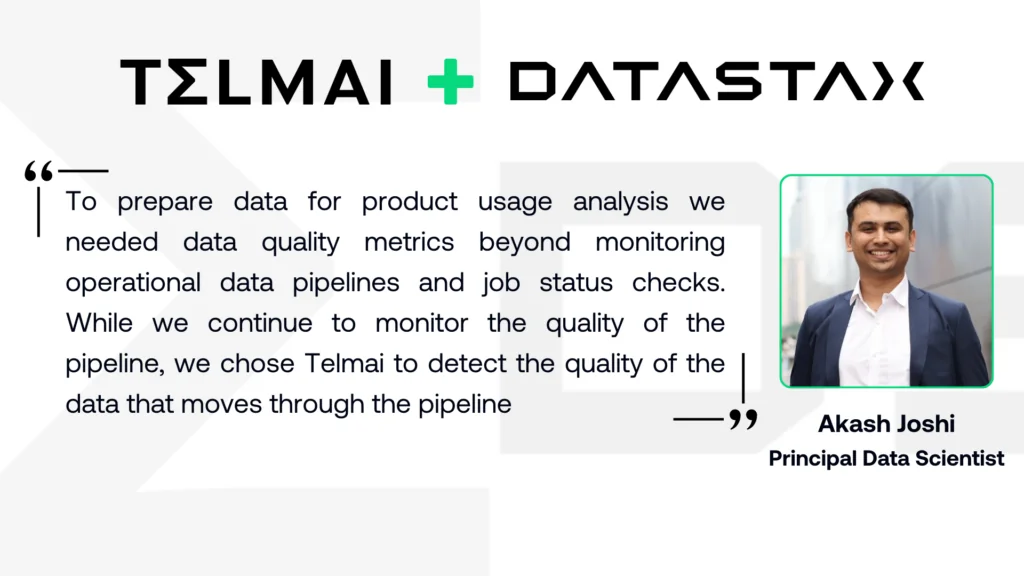
However, to track data quality at scale, DataStax needed a different approach and started to look for a solution that automates their process and is able to examine and investigate the actual data values and content.
Solution: ML-based data observability automates data quality for usage reporting across 36,000 clusters
With the realization and learnings from the past and to automate data quality at scale, the team decided to invest in the ML-based data observability solution of Telmai. With this automation, the high-caliber data engineering team could put their focus and resources on their core product advancement and leave the observability and monitoring to Telmai.
Today, Telmai monitors the actual data values, drifts, and anomalies in DataStax’s product usage. With Telmai, DataStax tracks
- Data accuracy, completeness, and uniqueness
- Drifts and trends in data over time (e.g., monitoring usage growth)
Telmai is placed between the data coming from the raw store (log data) and Google BigQuery. Selected tables and anonymized attributes from BigQuery are loaded into Telmai for tracking and monitoring. With Telmai Data Observability, DataStax is able to:
- Track users, clusters, and organizations
- Monitor the number of new clusters and conversion date (from sign-up) on a daily basis
- Observe drifts in volume/record count of clusters and investigate those records using a visual, no code data investigator product
- Track total read and total write within a cluster, segmented by usage date
- Detect usage drifts on total read and total write compared to the predicted thresholds
- Identify clusters with no usage
Telmai is deployed to track and monitor over 36,000 clusters, with an average of 10,000 daily active clusters.
Why Telmai

DataStax’s unique use case in measuring and tracking the usage of its cloud offerings and detecting false positives in data quality signals led them to select Telami to build
- Data Observability on data values, not just job statuses or metadata
- ML anomaly detection and prediction of future quality issues
- Trust in the data that supports business metrics and decision making
- Triggers, alerts, and notifications in case of any data drifts
See what’s possible with Telmai
Request a demo to see the full power of Telmai’s data observability tool for yourself.
