4 Misconceptions about data pipeline observability
Data pipeline observability is often misunderstood as a simple alerting system. However, it’s a vital component of the data pipeline, not just identifying issues but also preventing them, challenging the misconception that it’s merely an alarm system.

Data pipeline observability is often maligned as a mere alerting system. It is treated like the school hall monitor whose main job is to raise the alarm when Timmy tries to sneak into the teacher’s lounge. But here’s the catch: Data pipeline observability is so much more.
It’s not just a solemn bystander dutifully ringing the alarm bell when things go south, but the most crucial part of the data pipeline. You don’t just want to know when Timmy is breaking the rules; you want to stop him.
In this article, we’ll debunk this “it’s just alerts” misconception and take a hammer to a few other fallacies that will change the way you think about observability.
Misconception #1: It’s just alerts
Let’s start with the granddaddy of misconceptions – that data pipeline observability is just a fancy name for an alerting system. “Bing, bang, boom, something’s gone wrong, and it’s time to put on your superhero cape” is not the be-all and end-all of observability.
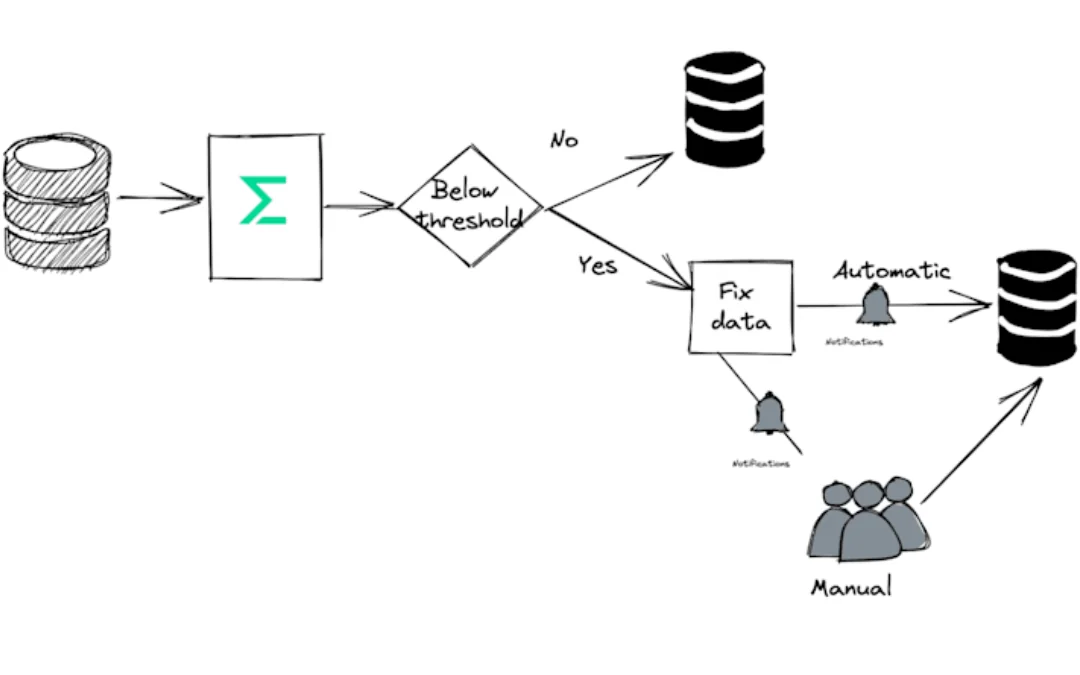
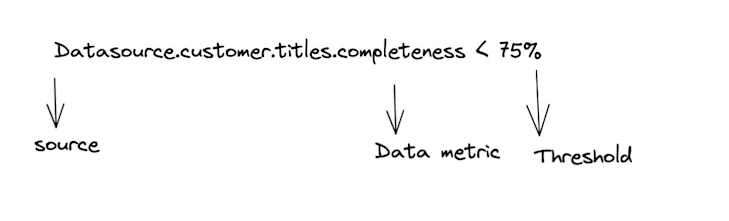
So what happens when a data metric is below an agreed threshold?
The user gets alerted, but that’s not enough. Users must also act on this alert, changing the pipeline workflow. This is known as the “Pipeline Circuit breaker pattern.” It has existed for a while in data engineering. However, what has changed is how data observability tooling can enable better orchestration of these patterns.
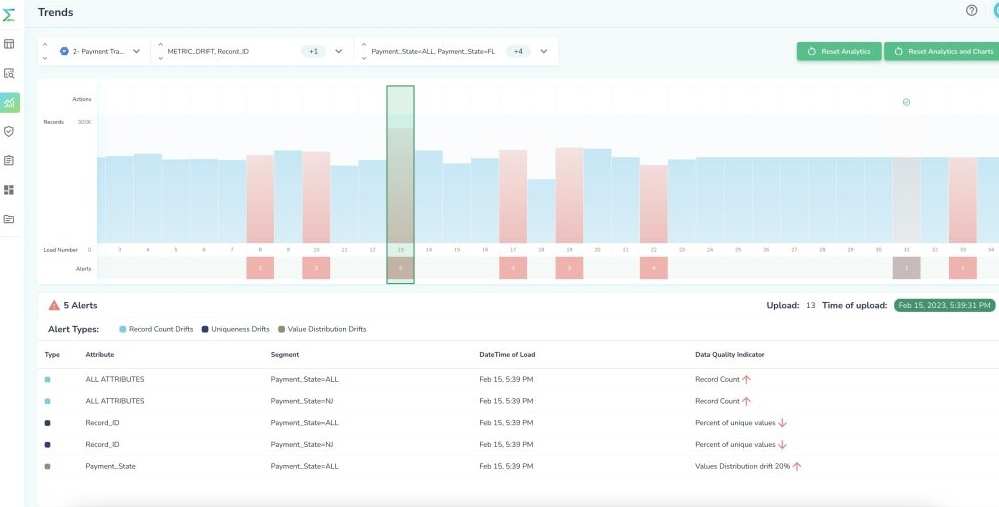
Let’s look at an example of a data pipeline:
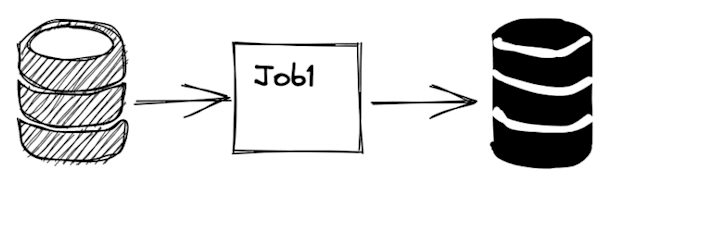
A pipeline consists of multiple transformation steps; you should monitor each step.
Each step can monitor multiple data metrics, and depending on the outcome of a reliability check, it will lead to alerts and orchestration.
Alerts
Depending on the severity of the issue and its impact, alerts can be one of three types:
- A soft alert is recorded in an observability tool like Telmai for later analysis and investigation.
- A user notification if the issue requires attention. Notifications can be sent via email, Slack, or a ticketing system so that the recipients can prioritize their responses.
- A pager alert if the issue requires immediate attention and is urgent.
Orchestration
Another outcome of monitoring is a change in pipeline workflow. However, this depends on the type of data metric and its downstream impact.
Let’s take an example of a pipeline step where a data pipeline observability tool like Telmai identifies incomplete data in an attribute, which is used as a join key.
This should mandate a repair job that needs to be launched automatically and then followed up by reprocessing the step in the pipeline where the problem was detected.
If you are using Airflow + Telmai, the DAG can leverage the response from Telmai’s API for its flow orchestration.
This approach’s advantage is that users can prevent low-quality data from propagating to downstream steps. The tradeoff is that it will add a small latency in the pipeline step.
Take an example of a pipeline step where a data observability tool identifies inaccurate job titles in an attribute used for targeted marketing campaigns.
This should not become a pipeline-blocking step, and the outcome of such a step can be either:
- Remediate (and a tool like Telmai makes it easy to identify these records to remediate) or
- Have the specific dataOps team segment and query records with complete titles.
The biggest advantage of this approach is that the pipeline flow has no latency, ensuring timely access to the fresh data.
These two simple examples make it clear that your pipeline workflow can be completely different based on the outcome of data observability.
So observability is not just about raising the red flag; it’s about understanding the intricate workings of your data pipeline and constantly monitoring, adjusting, and improving your data health.
Misconception #2: It adds latency
Time is money. Especially in industries like banking and financial services, the difference between milliseconds and nanoseconds can mean the difference between profits or losses.
Some data observability tools calculate metrics by querying the underlying database. This limits the amount of queries you can run and often requires sampling to avoid query timeouts.
Newer tools like Telmai, on the other hand, give you unlimited power to investigate all your data without needing to sample, or guess where to look for issues. Telmai does this through its use of Spark as a processing engine, allowing for decoupled data extraction and processing. This allows us to point out anomalies and provide insights without breaking your pipeline’s performance. Read more about how we optimized for monitoring data at a large scale.
Misconception #3: It’s just for big pipelines
Next up on our hit list of misconceptions – that observability is reserved only for the “big and complex” data pipelines. Oh, come now. Even the simplest of pipelines can trip and fall. And who’s there to help it get back up? You guessed it – observability. The sturdy cane supports your data pipeline, irrespective of its complexity. It ensures your data’s accuracy, smoothes out your workflow, and your troubleshooter is on standby. So, no, it’s not just for the ‘big boys.’ It’s for everyone.
Misconception #4: It’s only good for structured data
Last but not least, there’s this assumption that data pipeline observability is strictly a tool for structured data. This assumption tends to paint observability as a discerning food critic, turning up its nose at anything that doesn’t fit into neat, organized rows and columns. But let me assure you, modern data pipeline observability tools are not elitists. They appreciate the beauty of a five-course meal but aren’t averse to indulging in some street food or experimenting with fusion cuisine.

Telmai supports structured, unstructured, and semi-structured data sources. You can gain end-to-end visibility into your entire pipeline regardless of the type, form, shape, frequency, and volume of data in the pipeline.
From data myths to data enlightenment
So, there you have it. We’ve deconstructed, dismantled, and debunked the most stubborn myths around data pipeline observability. We’ve journeyed through misconceptions, all the way to the truth. And the truth is, data pipeline observability is more than alerts, is not just for the “big boys,” doesn’t add unnecessary latency, and is definitely not just for structured data.
In summary, you shouldn’t treat data pipeline observability as a boring BI tool where you only check in occasionally. If you set up the observability workflow right, it becomes the center of all your pipeline workflows.
But don’t take just my word for it. If you’re intrigued, and I hope you are, why not experience the magic of data pipeline observability for yourself? Telmai, a state-of-the-art data observability tool, is ready to demonstrate what it can do for your data pipeline workflows. Request a demo today.

Passionate about data quality? Get expert insights and guides delivered straight to your inbox – click here to subscribe to our newsletter now.
- On this page
See what’s possible with Telmai
Request a demo to see the full power of Telmai’s data observability tool for yourself.