What’s new in Telmai
Discover the latest updates from Telmai: support for semi-structured data, new integrations with Azure Blob, Snowflake, and Firebolt, Change Data Capture (CDC) support, and more. Experience automatic ML-based thresholds and data metric segmentation for efficient data monitoring.


I’m excited to share some of the latest features we have been working on at Telmai
We have added some fascinating functionality to our product this release, like,
- Automatic ML-based thresholds
- Support of Semi-Structured Data (JSON)
- New Integrations: Snowflake, Firebolt
- Change Data Control for SQL sources and Cloud data storage
- Data metric segmentation
- New Data Metrics: Table-level metrics + distribution drifts
Support of semi-structured data
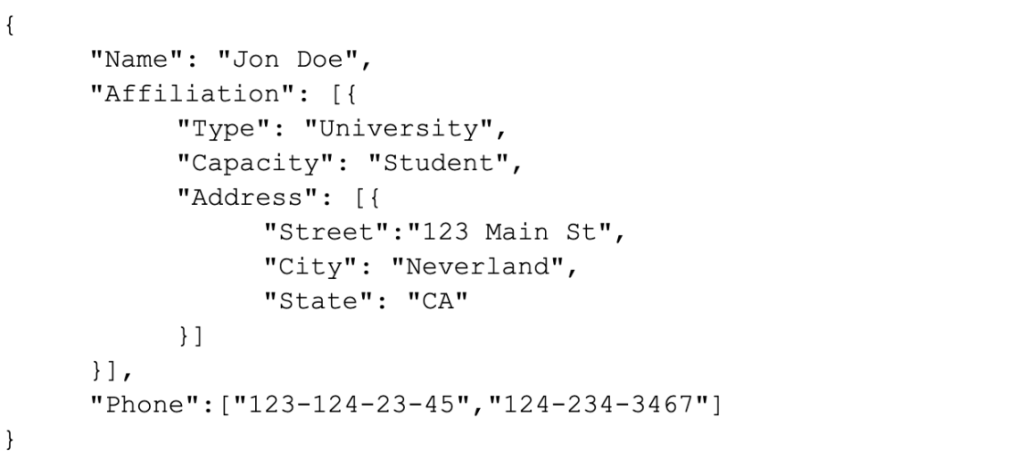
Most modern cloud data warehouses and data lakes now support semi-structured schemas. Data architects are leveraging this structure to design the most efficient data model for storage and querying. Providing quality metrics and KPIs that are aware of such systems is crucial for establishing accurate observability outcomes.
Hence, telmai can now monitor not only flat data but also files and Data Warehouse tables with semi-structured schema (i.e., nested and multi-valued attributes.). Telmai is designed to support complete analysis of complex data with thousands of attributes without any impact on performance.
New integrations: Snowflake, Firebolt
We added support for Azure Blob, Snowflake, and Firebolt in addition to BigQuery, CloudStorage, S3 and local files.
All SQL sources now support both flat and semi-structured schemas and can be configured for Change Data Capture(CDC).
Stay tuned for a separate blog on these integartions.
Change data capture(CDC) support
Telmai provides a way to schedule runs with specific periodicity, i.e., hourly, daily, or weekly for any source. Additionally, you can configure Telmai to process and monitor only the portion of the data (delta) which changed between the runs. For Cloud storage, the delta is determined via file metadata. For SQL sources, users can specify an attribute holding records creation/update timestamps, which is then used to read freshly changed records.
CDC support is additional to the full database and table analysis i.e we can provide metrics and alerts on total data as well changed data.
This powerful functionality will enable users to review trends and drifts holistically for the entire data set and only for changed data.
Data metric and threshold segmentation
Data in the same table often needs to be analyzed and monitored separately as the trends may vary based on specific dimensions, like different customers or geographic regions.
From this release, Telmai allows users to specify this dimension in the data source, enabling both holistic metric and segmented analysis.
Automatic ML-based thresholds
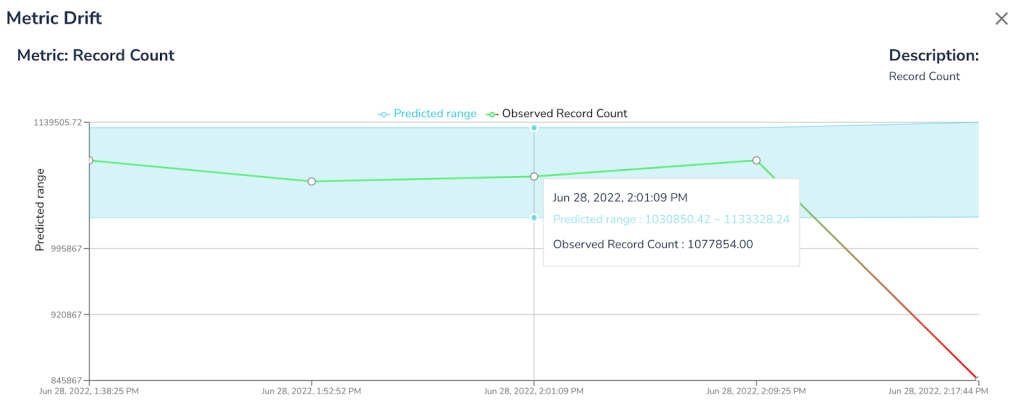
With our low-code no-code approach, Telmai calculates thresholds for each data metric on your dataset. These ML-based thresholds are now enhanced to evolve with your data without any configurations.
Telmai will automatically establish and predict trends over key metrics, like % of non-null/empty values, number of records, % of unique values and many more. When an observed value of a metric is outside of prediction boundaries Telmai will issue an alert and send a notification to subscribers.
New metrics: Distribution Drifts
In addition to various data metric drifts like record count, completeness etc., Telmai can automatically detect unexpected changes in distributions of categorical data or changes in the distributions of value patterns:
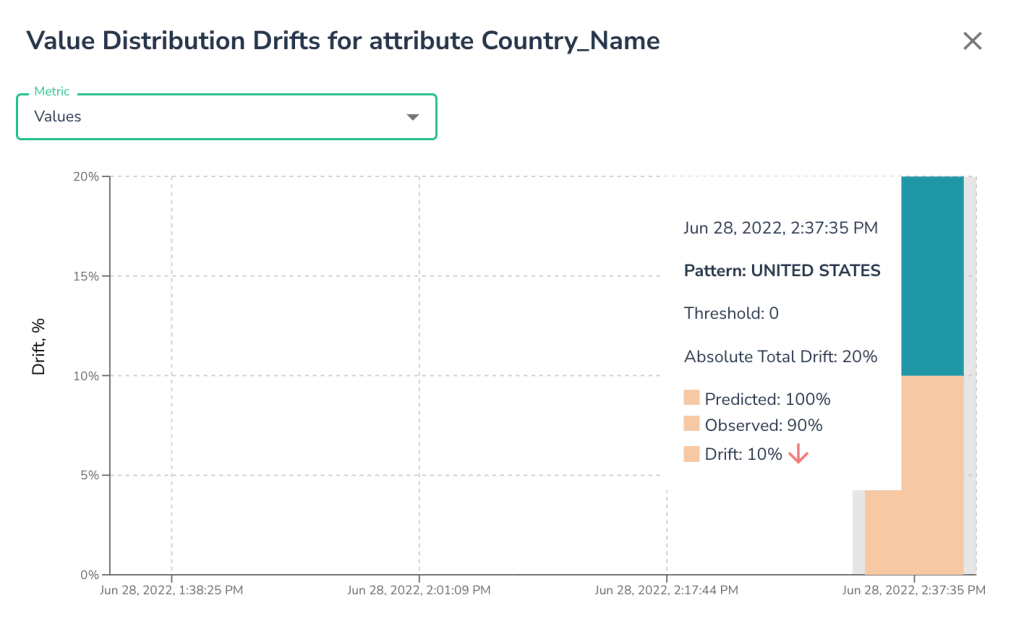
Often categorical data is used to understand the segmentation of business, and sudden drift in such distributions could have a direct potential impact. With this automatic alert, data teams can be proactively aware of such drifts to investigate before any business impact.
All of the above and much more functionality have been added to our product. If you would like to learn more about these features and how they apply to your use case, feel free to schedule a demo using this link
Passionate about data quality? Get expert insights and guides delivered straight to your inbox – click here to subscribe to our newsletter now.
- On this page
See what’s possible with Telmai
Request a demo to see the full power of Telmai’s data observability tool for yourself.