What’s new at Telmai
Explore Telmai’s new Data Health Dashboard for real-time health metrics, use custom SQL queries for personalized data monitoring, and leverage expanded business metrics monitoring. Learn about our partnership with Databricks for enhanced data pipeline reliability and read our case study on how DataStax utilizes Telmai for product usage monitoring.


The last few months have been super exciting at Telmai. We have onboarded new customers, added product capabilities, announced new partnerships, and gotten ourselves some industry accolades.
Big thank you to our amazing customers for trusting in us!
We have gotten ourselves a 5-star review on G2. These high marks have qualified us to debut on G2’s Data Quality Grid® Report as a High Performer. Over the past few months, these reviews have been our most rewarding experience. Our commitment to our customers remains our top priority as we continue to grow.
Other key highlights:
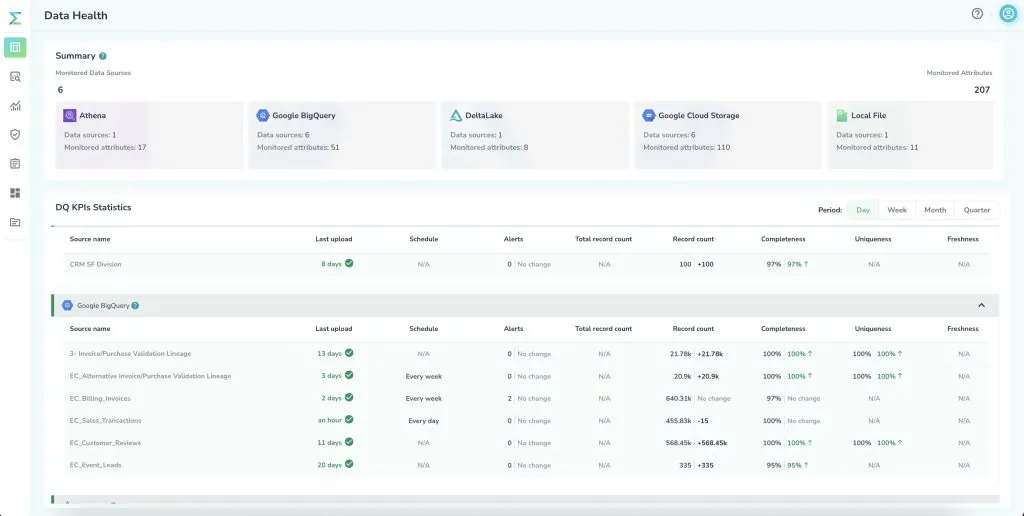
- New Data Health Dashboard. Telmai users now have a bird’s eye view of real time health metrics across all monitored data systems in their data pipelines. You can monitor all batch and streaming workflows and see how your data quality metrics progress or digress over time. Get dynamic updates in the dashboard as Telmai monitors data in the background. For more information, see our docs.
- Custom SQL Queries. This superpower feature allows you to customize your data monitors without creating custom views in your database. This is valuable when you don’t have permission to create these views or just want to avoid polluting your database with additional schemas. With custom queries, you can monitor derivative attributes (e.g., Transaction Age via Today’s Date (dynamic) – Transaction Date) or correlated attributes (e.g., Transaction Amount divided by Cost) or exclude records via a custom condition (e.g., monitor Transaction Amount > $100,000).
- Business Metrics Monitoring. We have expanded our metrics monitoring beyond core data quality to now support business metrics monitoring. Examples include monitoring drifts in the sum, average, and count of values of numeric attributes such as payments, transaction amount, or total sales grouped by one or millions of dimensions.
- Databricks Partnership. In March, we also announced our partnership with Databricks. We have certified our platform integrations with Delta Lake and Unity Catalog to accommodate Databricks users with continuous reliability of their batch and streaming pipelines and real-time data quality monitoring of their Data Lakehouses and cataloged data sets. To learn more about our capabilities, read our blog here.
- DataStax Case Study. We are proud to support DataStax as one of our top customers. Using Telmai, DataStax has built automated data quality and observability for its product usage monitoring of over 36,000 clusters. You can read the case study with DataStax here.
As we continue to add new capabilities and update our platform with your requests, please let us know what is top of mind for you.
To learn more about Telmai, contact me or request a demo.
Passionate about data quality? Get expert insights and guides delivered straight to your inbox – click here to subscribe to our newsletter now.
- On this page
See what’s possible with Telmai
Request a demo to see the full power of Telmai’s data observability tool for yourself.