The 12 data pipeline metrics that matter most
A data pipeline is only as good as the data it handles. Measure how well your pipelines perform with metrics like throughput rate, data completeness, downtime, and more. I categorize each metric into three buckets – performance, quality, and efficiency – each critical for maintaining a robust data infrastructure.


Data pipelines—the unseen but crucial infrastructures that underpin modern business—require meticulous monitoring and recalibration. Without proper oversight, they risk becoming your company’s Achilles’ heel, undermining the very efficiency and insight they are meant to provide.
To keep things humming, businesses deploy a sophisticated array of data pipeline metrics, each illuminating different facets of the data processing journey.
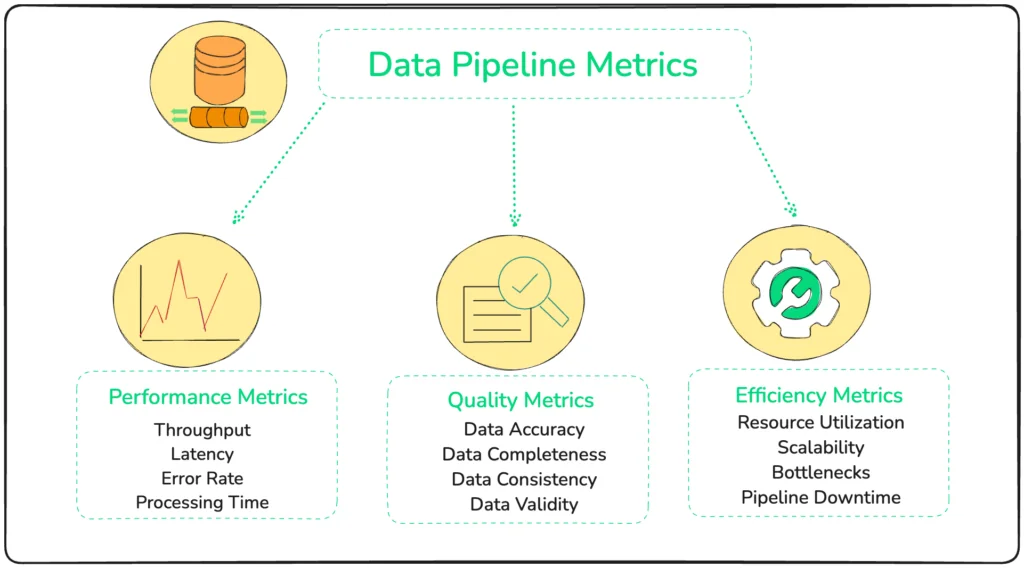
Performance metrics serve as the initial checkpoint, gauging the raw horsepower of data processing.
Quality metrics then take the stage, ensuring that the data pipelines do not merely function; they function correctly. The data should reliably mirror the nuanced complexities of the business they represent.
Efficiency metrics finally come into play, focusing on the sustainability of operations. Resource utilization, scalability, bottlenecks, and pipeline downtime are scrutinized to ensure that the system’s architecture is not just robust but also resilient and adaptable.
Let’s look at the most important metrics within each of these in depth.
Performance metrics
Performance metrics form the cornerstone of effective data pipeline management. By meticulously monitoring and optimizing throughput, latency, error rate, and processing time, you can ensure that your pipelines operate at peak performance.
Here’s a concise bullet-point overview of each performance metric:
Throughput
- Measures the amount of data processed per unit of time.
- Indicates the capacity of the pipeline to handle large volumes of data.
- High throughput signals a robust system, crucial for real-time analytics and decision-making.
Latency
- Measures the time taken for data to travel through the pipeline.
- Critical for operations requiring immediate analysis and action.
- Lowering latency enhances the pipeline’s responsiveness and operational agility.
Error Rate
- Tracks the frequency of errors or failures during data processing.
- A high error rate suggests issues with data integrity or pipeline configuration.
- Reducing the error rate is essential for maintaining data reliability and accurate decision-making.
Processing Time
- Measures the duration of processing individual data units or batches.
- Reflects the pipeline’s operational efficiency in converting raw data into insights.
- Optimizing processing time ensures timely data analysis and supports real-time operational needs.
Data quality metrics
Data quality metrics ensure that pipelines maintain the trustworthiness of data. While nobody can agree on how many data quality metrics there are, I believe that among the 5 important data quality metrics, the 3 discussed below are fundamental:
Data accuracy
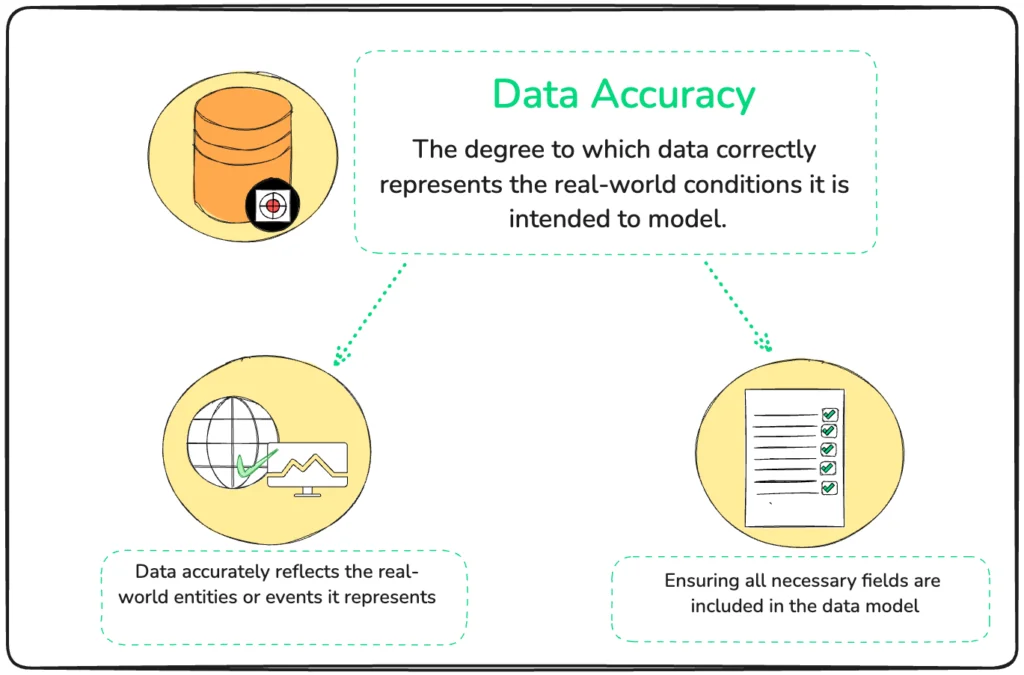
- Measures the correctness and precision of the processed data.
- Ensures that data accurately reflects the real-world entities or events it represents.
- Critical for making reliable business decisions and analytics.
Data completeness
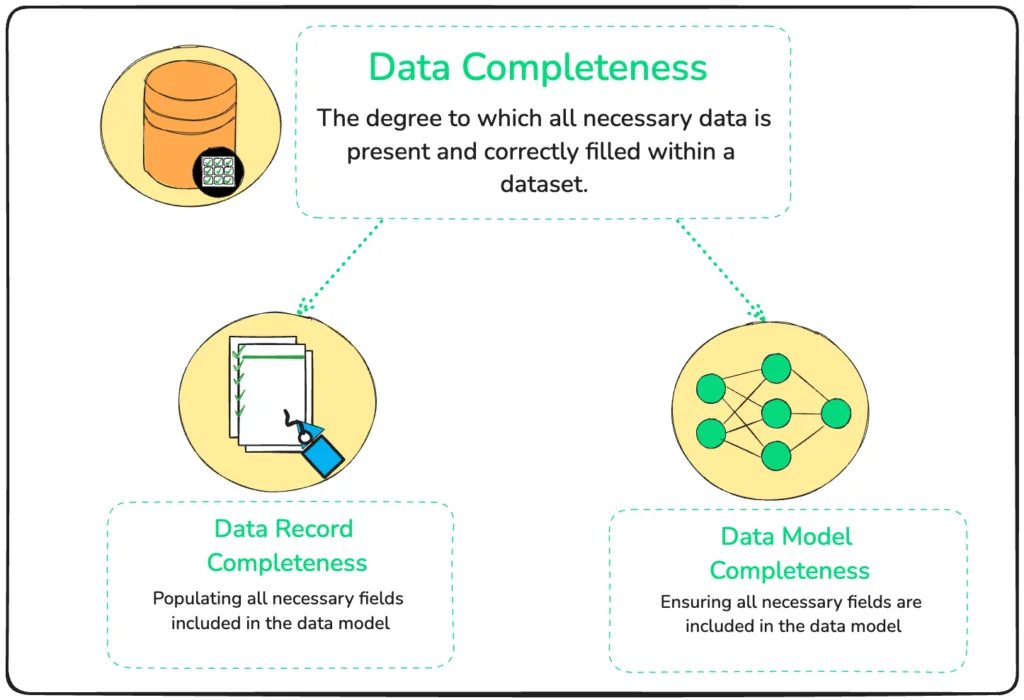
- Assesses the presence of all expected data elements within the pipeline.
- Prevents issues arising from missing data, ensuring analyses are based on full datasets.
- Important for maintaining the depth and richness of insights derived from the data.
Data consistency
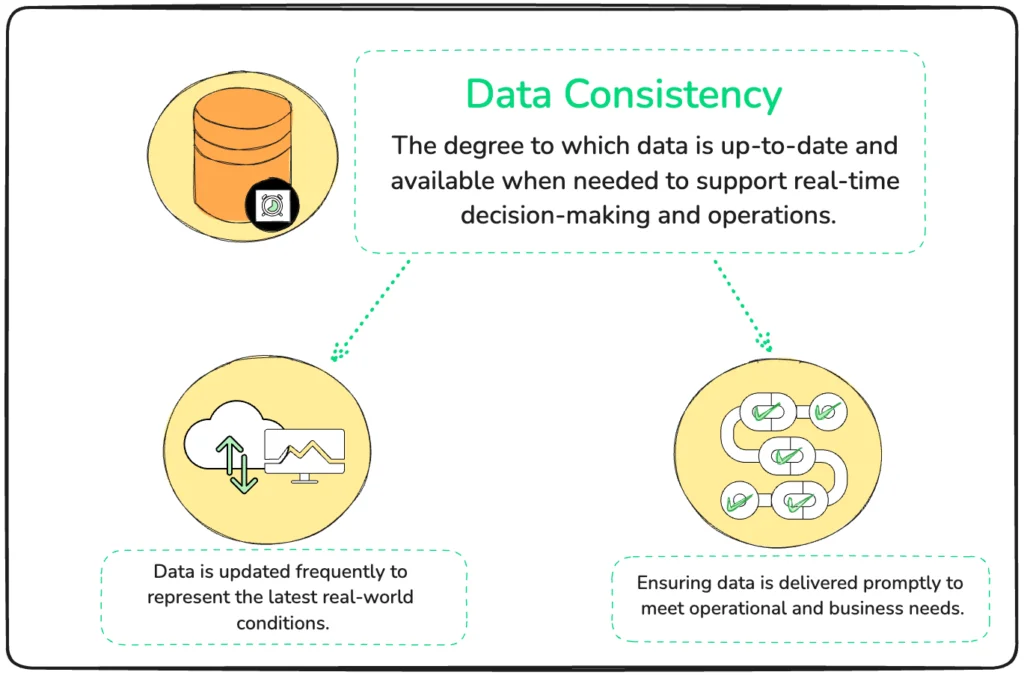
- Checks for uniformity and coherence of data across the pipeline.
- Ensures that data remains consistent across different parts of the system or over time.
- Vital for aggregating, comparing, and analyzing data from multiple sources or time periods.
Data validity
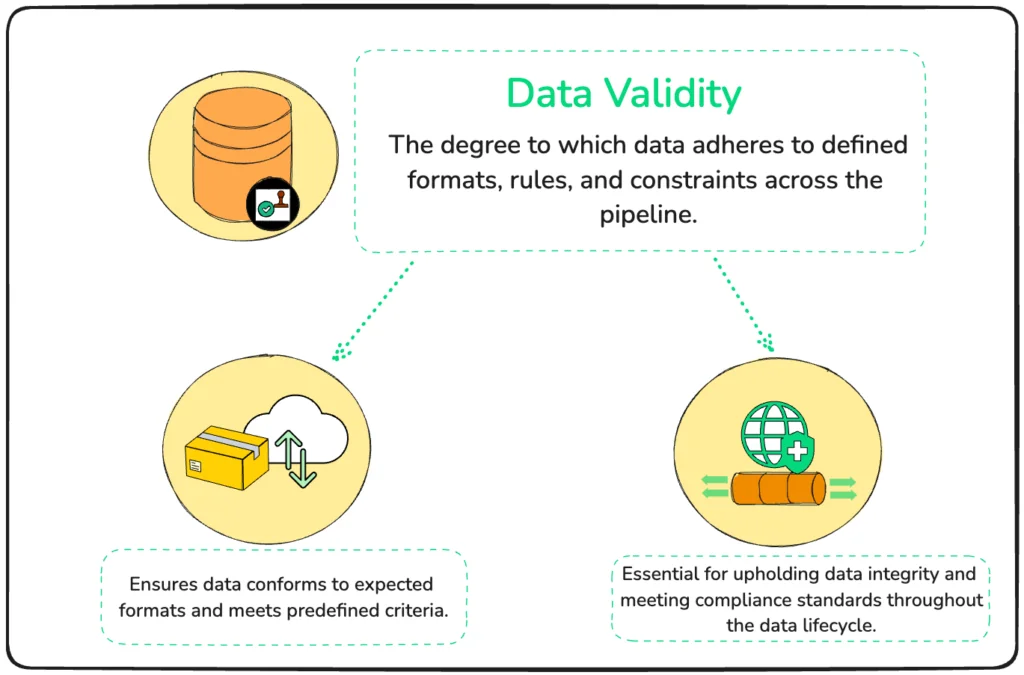
- Ensures the accuracy and reliability of data throughout the pipeline.
- Verifies that data meets predefined criteria and adheres to expected formats.
- Crucial for maintaining trust and integrity in data-driven decision-making across systems and time.
Efficiency metrics
Efficiency metrics focus on optimizing resource consumption and ensuring scalability to meet future demands. Here are the metrics to focus on to get a view of your data pipeline’s operational health:
Resource utilization
- Monitors the consumption of system resources (CPU, memory, disk) during data processing.
- Enables optimization of resource allocation, preventing overuse and underuse scenarios.
- Critical for maintaining cost efficiency and ensuring smooth pipeline operations.
Scalability
- Assesses the pipeline’s capability to manage increasing volumes of data efficiently.
- Indicates the system’s readiness for growth, ensuring that it can accommodate future data needs without degradation in performance.
- Essential for businesses scaling up operations or experiencing data growth.
Bottlenecks
- Identifies and addresses points within the pipeline where data flow is impeded, causing delays.
- Pinpointing bottlenecks is crucial for enhancing data processing speeds and overall pipeline efficiency.
- Continuous monitoring and tweaking of the pipeline architecture are required to ensure optimal performance.
Pipeline downtime
- Measures the frequency and duration of pipeline outages or maintenance periods.
- Minimizing downtime is key to maintaining continuous data availability and operational continuity.
- Insights gained from tracking downtime can guide preventive maintenance and improve system reliability.
Be proactive by preventing data pipeline issues with data observability platform Telmai
You shouldn’t treat data pipeline metrics as numbers you only check in on occasionally. It’s always better to anticipate issues rather than react to them, and that’s where data observability comes in.
Data observability tools like Telmai train themselves on your data to detect anomalies and can automate quality checks and flag faulty data values as often as they happen and before any downstream impact.

Telmai integrates every data source and data type—no data cleanup, pre-processing, or transformation required. Its root cause analysis and UI-based investigator provide deep insights into data lineage, trends, and more.
Try Telmai today, and transform the way you observe, manage, and optimize your data pipeline metrics.
Passionate about data quality? Get expert insights and guides delivered straight to your inbox – click here to subscribe to our newsletter now.
- On this page
See what’s possible with Telmai
Request a demo to see the full power of Telmai’s data observability tool for yourself.


