Telmai monitors any source in data pipelines, but how do we do it?
Discover Telmai’s unique data monitoring capabilities, designed for any pipeline step and optimized for large-scale operations. Experience low latency and high scalability with our system, built on architectural blocks that set us apart from typical SQL database monitoring systems. Telmai leverages distributed computing via Spark for efficient, large-scale data monitoring.


Abstract
Telmai is designed to monitor data at any pipeline step, be it a source or a destination. And it does it at scale and with low latency. Our system is built upon architectural blocks which significantly differ from a typical homegrown system designed to monitor SQL databases/engines. Telmai, on the other hand, uses distributed computing via Spark and is highly optimized for monitoring data at a large scale.
This blog highlights some architectural decisions that helped us achieve scale, versatility, and efficiency.
Data monitoring requirements
Over the last decades, companies have embraced many new technologies in the data ecosystem for two reasons: to uncover newer use cases (revenue) or lower cost.
The former heavily depends on the reliability of the data, and the latter is always a consideration for everyone evaluating the tools that support the use case.
So when we were designing Telmai, the critical consideration was to build a system that is a step ahead in speed, scale, and costs required for these new data use cases. In this blog, we’d like to share some of the architectural decisions we went with.
Our requirements for building a robust monitoring system came down to:
- Shifting data monitoring to the left, in other words finding issues closest to their source in order to reduce MTTD and MTTR (mean time to detect and resolve)
- Scale and workload isolation to be able to support vastly increased number and size of data sources to be analyzed
- Performance – finding problems timely to fit in the strict time windows for remediation activities
- Deployment flexibility to ensure versatility of data sources and the fact data is not suppose to leave the clients security perimeter
- Cost efficiency to avoid incurring high infrastructure costs for monitoring, be it ingress/egress or compute.
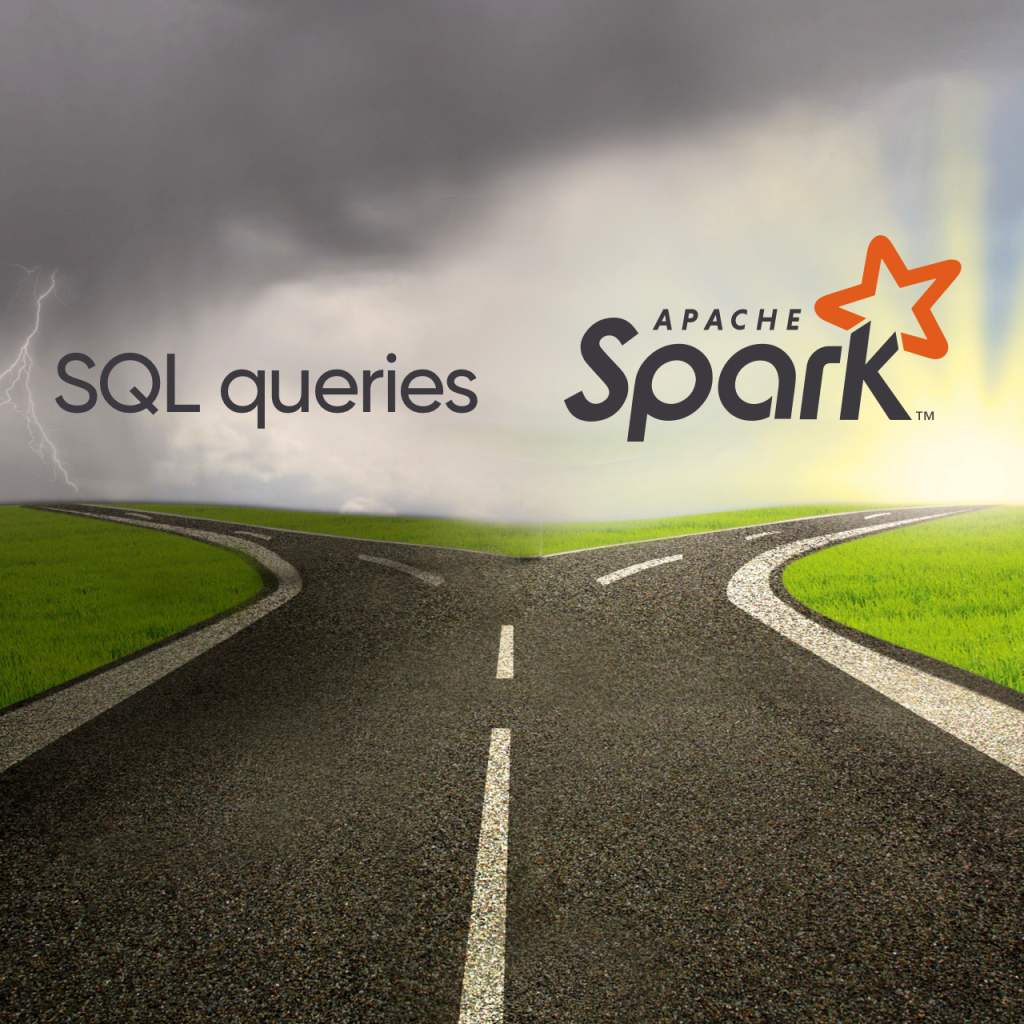
So, with all these considerations, we outlined two options: building Telmai by connecting directly to a Data warehouse/SQL engine and running SQL queries to calculate the metrics, or using an external processing engine, like Spark, to perform all the calculations to generate the metrics.
There were pros and cons to both. While the SQL one works well for monitoring Data warehouse or BI tools, for our requirements, the Spark option felt more compelling, and below you can learn why so.
Shifting data monitoring to the left
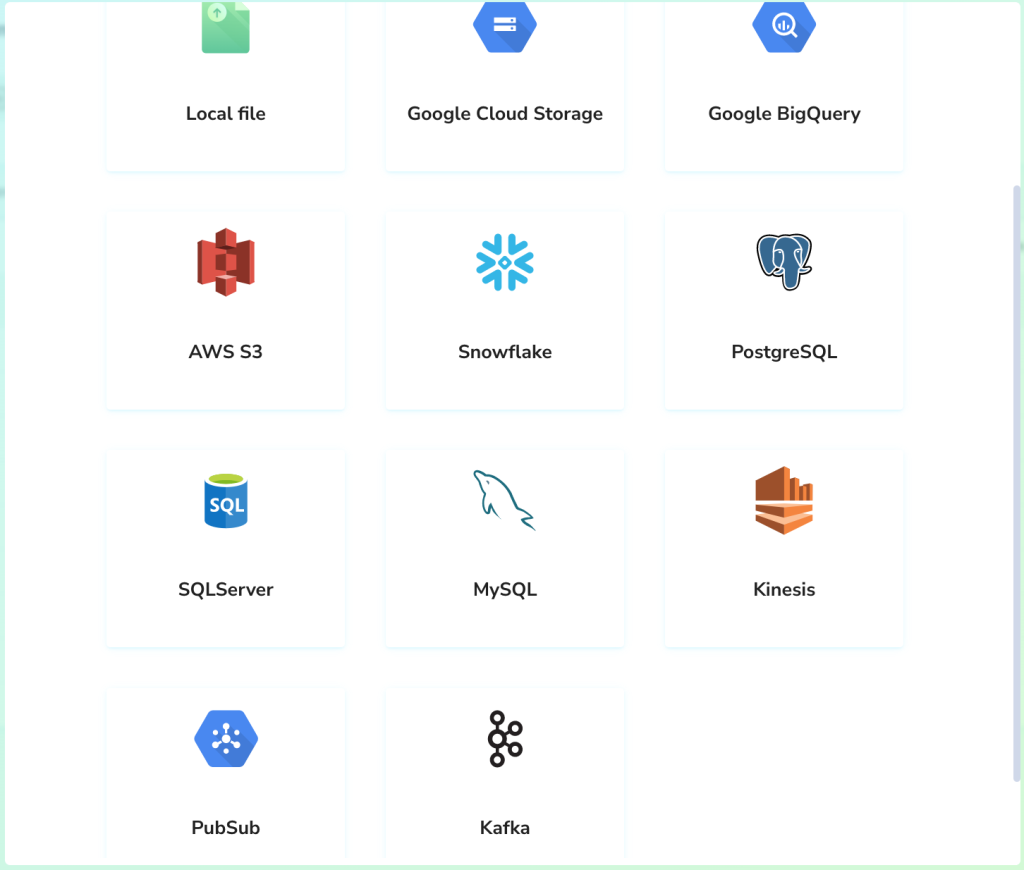
This means quickly plugging into any source that can contribute to data issues. In other words, read anything – various file formats (parquet, CSV, JSON, archives, etc.), multiple databases like HBase, Cassandra, SSTables, subscription topics, ex. Kafka or even Spark dataframes while data is still being processed with Spark-based ETL.
When data comes from such a diverse group of sources, it’s a problem by itself to first extract and then load data into a system. The data warehouse was restrictive as it often fails the load jobs during schema validation. It requires additional efforts and transformation jobs to run before loading the data, introduces additional delays and failure points, and defeats the purpose of monitoring as early (i.e., leftmost) as possible. So if we wanted our clients to shift their monitoring to the left, we had to choose an architecture that would support this easily.
Scale
When monitoring is shifted to the left, it means more sources to be analyzed and much more data in general. This data is often raw that hasn’t had any cleanup/aggregations. Doing this without creating a bottleneck in the pipeline was a critical consideration for us. Spark offers a great help here, as it allows the launch of many auto-scaling clusters to work in parallel, ensuring the system’s excellent overall throughput. Such flexibility was hard to achieve even with managed data warehouses.
Pipeline performance
Calculating metrics is compute-intensive. And monitoring requires a lot of them. Each attribute requires running numerous aggregations to understand various value distributions, completeness, mean frequency, values ranges, standard deviations, etc. This gets even more complicated when multivalued attributes are present, and the size gets to a terabyte and petabyte scale.
Having hundreds of attributes and calculating dozens of metrics for every attribute will require thousands of queries(or jobs). Each analytical SQL engine has a significant overhead for every query due to planning, which can quickly get out of hand in real-life situations.
By having a deeper control over the execution flow with Spark, we can utilize a highly-optimized logic for very wide (a large number of attributes and metrics) datasets and avoid bottlenecks with the general-purpose SQL approach. Transforming data into a very long skinny (key-value) representation allows us to run with a constant number of analytics jobs and not be affected by many metrics, which comes very handy with an exploding number of custom metrics and attributes to monitor.
Deployment flexibility
We knew our clients needed deployment flexibility for data security.
The use of Spark as a processing engine allowed for decoupling data extraction and processing, bringing both closer to the monitored data. That means running processing anywhere in the network topology, for example, via EMR clusters in the same or peered VPC to where monitored HBase or Cassandra clusters are. It eliminates unnecessary security vulnerabilities and challenging questions from infosec teams.
In short, Spark helps us to enable SaaS via public or private cloud options and extend coverage for on-prem Spark/Hadoop setups.
Cost considerations and budgeting
Being a decoupled processing infrastructure, Spark was our choice to help us cleanly separate workloads, avoid unnecessary load on DL and DW engines, and quickly control and isolate monitoring costs from other business-driven initiatives.
Summary
To securely monitor any step in the data pipeline at scale without compromising product features, we needed to future-proof our architecture. We relied heavily on distributed compute architecture via Spark to achieve our architectural goal.
Passionate about data quality? Get expert insights and guides delivered straight to your inbox – click here to subscribe to our newsletter now.
- On this page
See what’s possible with Telmai
Request a demo to see the full power of Telmai’s data observability tool for yourself.
Articles
See all articles


