Start your data journey with Profiler++
Embark on your data journey with Telmai’s Profiler++, a tool designed to ensure data quality and prevent reputational losses. It combines machine learning with the expertise of data professionals to analyze, monitor, and understand your data, transforming the way you manage data quality.


Whether you onboard 3rd party data or curate data for your customers, internal or external, Data Quality is one of the most important considerations. Selling data of poor quality will inevitably result in reputational losses, negatively impacting your business. Whereas onboarding bad data could ruin your other data initiatives, corrupt downstream systems and lead to inaccurate analytics, which in turn leads to business losses.
Ensuring good quality of data requires implementing robust practices in the following areas:
- Understand your data, specifically the unknowns or “blind spots”
- Monitor your data – proactively alert when data deviates from norm
- Build your data platform to leverage data confidence score so the bad data and good data are treated differently
We’ve spoken about the importance of data monitoring extensively, let’s now take a look at the first step – understanding the data.
Understanding data
For years, one of the most handy tools for data experts was profiling. There are a number of free, open source and commercial products for data profiling available in the market.
Data Profiling is a process of analyzing data and summarizing this information in the hope of assessing quality of the data. For example, finding what are the attributes in the dataset, what is the distribution of values, top or least frequent values, percentage of populated and unique values etc.
The consumption of profiling reports is manual, time consuming and quite honestly, boring. It becomes even more challenging when reports provide too much detail so it quickly becomes overwhelming. On the other hand, if it’s very high level, it would be hardly useful as it will uncover only a few of the most visible problems (Figure 1).
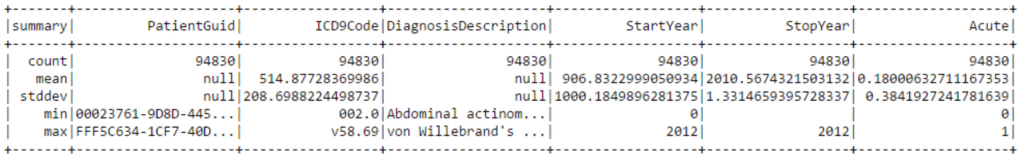
Now, if you multiply it by drastically increased volume and velocity of data in recent years, it becomes clear that profiling in its classic interpretation is no longer up to the task. So are we doomed? Fortunately not.
Introducing the Telmai Profiler++
It’s clear that just throwing more information at people in the hope that it will solve data quality concerns is not going to work. Fully relying on ML to detect and act on data issues also doesn’t seem very feasible as there is a tremendous amount of knowledge and context about data in the heads of data experts accumulated for years working in specific data domains.
So we’ve combined ML and the intuitive and seamless experience of data experts together to bring to you Profiler++. ML does what it does best – crunching through tons of statistical data and bringing up the most valuable information. Whereas the experts can shine at what they do best – applying all their knowledge in making decisions based on that information.
Telmai’s engine processes data, collects tons of statistical information, significantly more information than a typical profiling tool would, which is then fed to the ML engine, where all of this information is analyzed and then brought to the user via fast, interactive and engaging user experience. So instead of reading a thick folder of statistical reports, it’s like watching a movie which tells you a story about your data.
Passionate about data quality? Get expert insights and guides delivered straight to your inbox – click here to subscribe to our newsletter now.
- On this page
See what’s possible with Telmai
Request a demo to see the full power of Telmai’s data observability tool for yourself.