Lightweight, yet powerful: what makes lightweight data quality tools stand out
Discover the efficiency and power behind lightweight data quality tools designed for modern data management. In this article, you’ll learn more about how these tools streamline data accuracy and integrity checks without the need for complex setups or extensive coding, making them ideal for businesses of all sizes.

Data underpins all strategic decisions, and ensuring its quality is critical. Traditional methods often involve manual checks and complex, time-consuming procedures that can lead to errors and inconsistencies. However, there’s a more straightforward path to ensuring data quality: Lightweight Data Quality tools.
These tools can provide seamless integration and monitor the quality of multiple data sources in real time. They ensure decentralized data quality management, enabling all users to evaluate data health and identify the root causes of issues through insightful dashboards and critical health metrics. With comprehensive integrations, Lightweight data quality tools simplify data profiling and remove the need for engineering efforts in data preparation.
Let’s dive into the key elements of lightweight data quality tools.
Data quality
Data quality KPI dashboards
Lightweight data quality tools offer a comprehensive dashboard that focuses on crucial data health KPIs, enabling users to easily understand their data’s health. With such a dashboard, you gain complete visibility into your data pipeline, covering every type of data, its form, frequency, and volume, without relying on sampling. This approach ensures no detail is overlooked, as sampling often misses critical anomalies and patterns by only analyzing a subset of data, potentially leading to incomplete insights and overlooked data health issues.
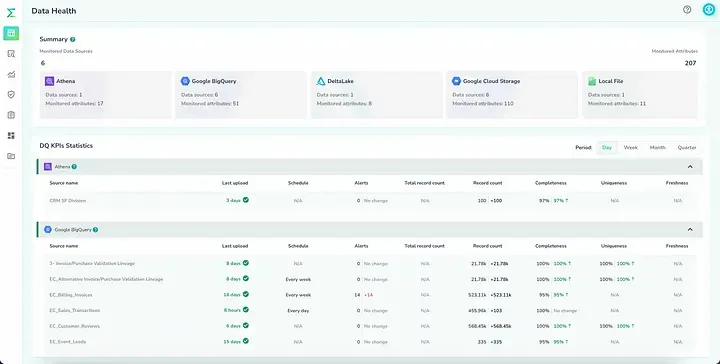
As shown in the screenshot above, these dashboards allow for a deep dive into the specifics, analyzing data to the column value level. You can compare your current data state against historical averages—daily, weekly, monthly, or quarterly—to spot trends and measure improvements over time. The tool’s versatility shines as it analyzes data from a wide array of sources, including data warehouses, analytic databases, data lakes, semi-structured sources like JSON, streaming data such as Kafka queues, and data extracted from APIs, ensuring a thorough understanding of your data’s integrity and health.
Data quality validation
Data quality rules are necessary and serve as checks and balances to monitor data and maintain its accuracy, consistency, and relevance. Crafting data quality (DQ) rules can be quite challenging. The complexity of the data, coupled with the need for nuanced domain expertise, can make the process highly iterative and time-consuming.
Lightweight DQ tools simplify the creation of data quality rules with their intuitive profiling capabilities and interactive, user-friendly rule-building interface. By democratizing the rule-creation process across tech teams and businesses, these tools enable business teams to oversee their data’s integrity directly, thus avoiding delays when relying exclusively on central data engineering resources.
Data quality rules can be classified into:
- Record Level Rules
- Column Level Rules
Record-level rules are simple to implement and use. It can be generalized into a template that can be reused across many attributes and tables. Below is an example of a simple rule that validates the data with the list of accepted values.

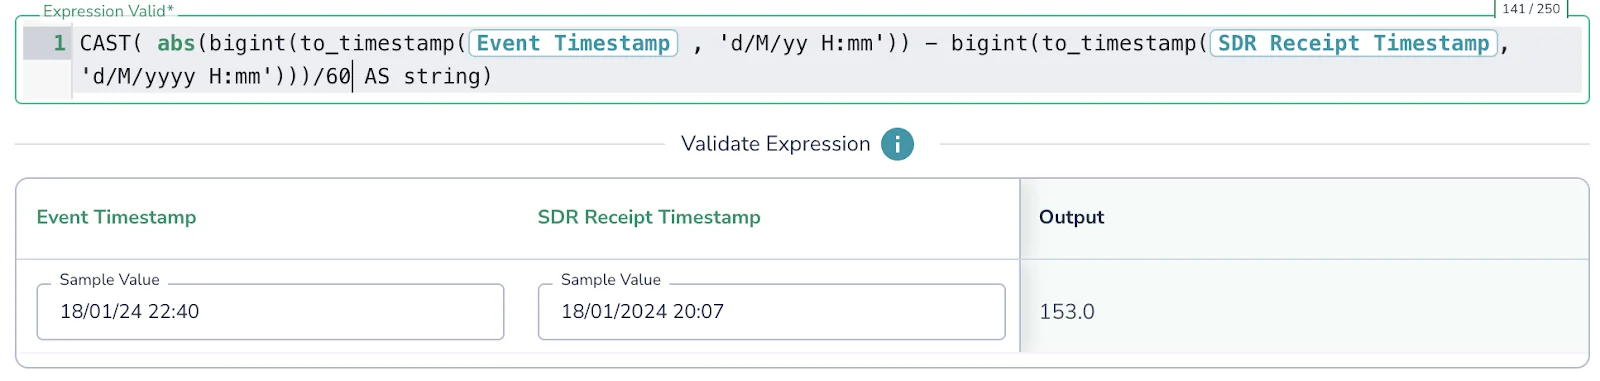
On the more complex end of the spectrum, record-level rules might incorporate intricate logical expressions that require computations across multiple attributes within a record. The screenshot below displays an example where the rule employs an SQL expression to calculate the time difference in minutes between two timestamps—’ Event Timestamp’ and ‘SDR Receipt Timestamp’. This rule helps verify time-based data consistency within a dataset, ensuring that the records adhere to expected time intervals and sequences.
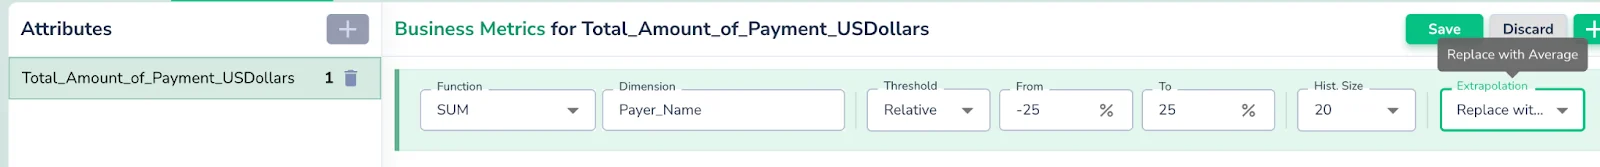
Column-level rules take a broader view, focusing on the data in aggregate. These rules often involve custom aggregations to validate the data against set thresholds, which could be relative or absolute. The example below shows a rule that confirms that the total payments for each payer do not deviate by more than 25% from a historical average.
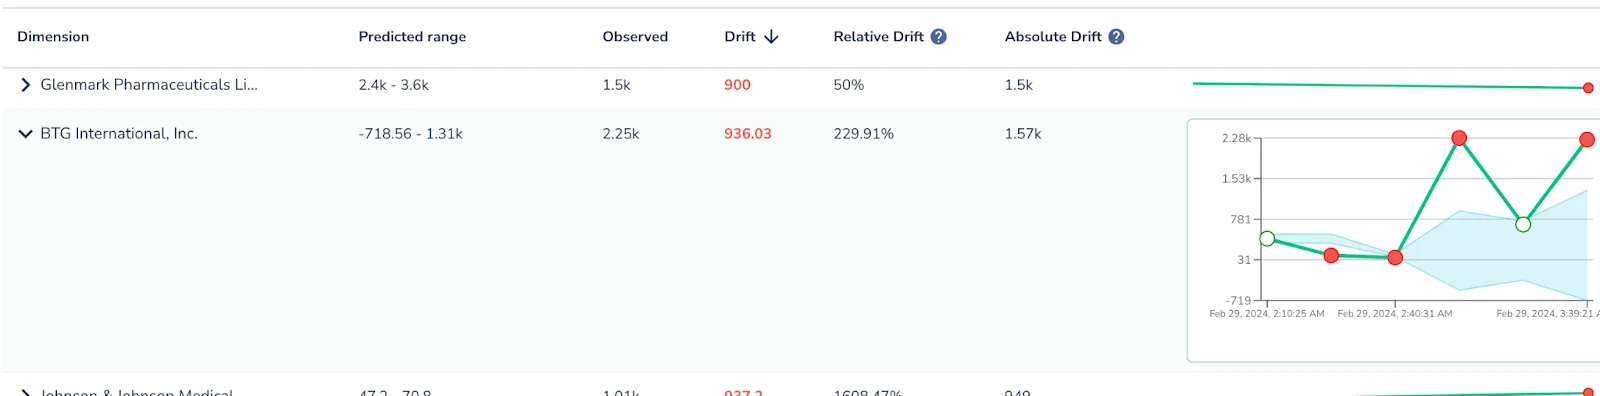
Crafting these rules using native SQL offers flexibility but can be impractical for managing numerous rules, leading to inefficiency and increased dependency on data engineering teams. Lightweight DQ tools offer a low-code/no-code alternative that empowers business teams to implement and manage these rules. As illustrated below, users can understand column-level rule violations and pinpoint precisely where the data deviates from expected norms.
Data profiling
Data profiling is an essential step in ensuring Data Quality. It involves examining your data to gain high-level insights about its quality and structure.
However, it can be resource-intensive, potentially inflating costs and burdening infrastructure if not appropriately managed.
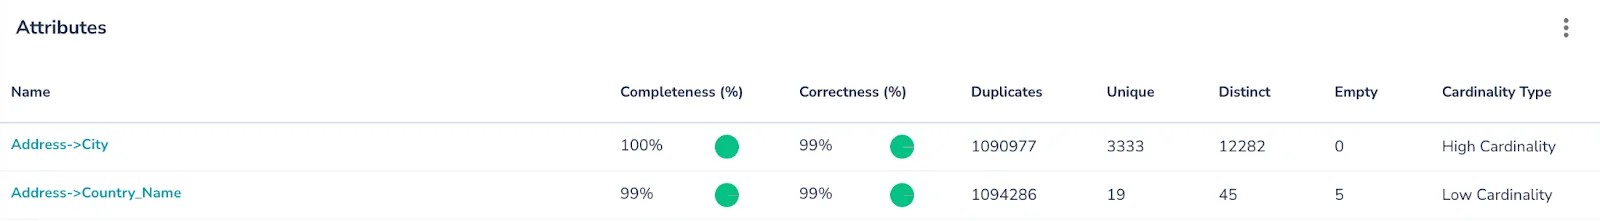
Lightweight DQ tools, equipped with advanced machine learning, simplify data profiling. They enable users to easily assess key data health indicators such as correctness, completeness, and duplication. The screenshot below demonstrates how lightweight DQ tools would allow users to quickly verify the completeness and accuracy of data.
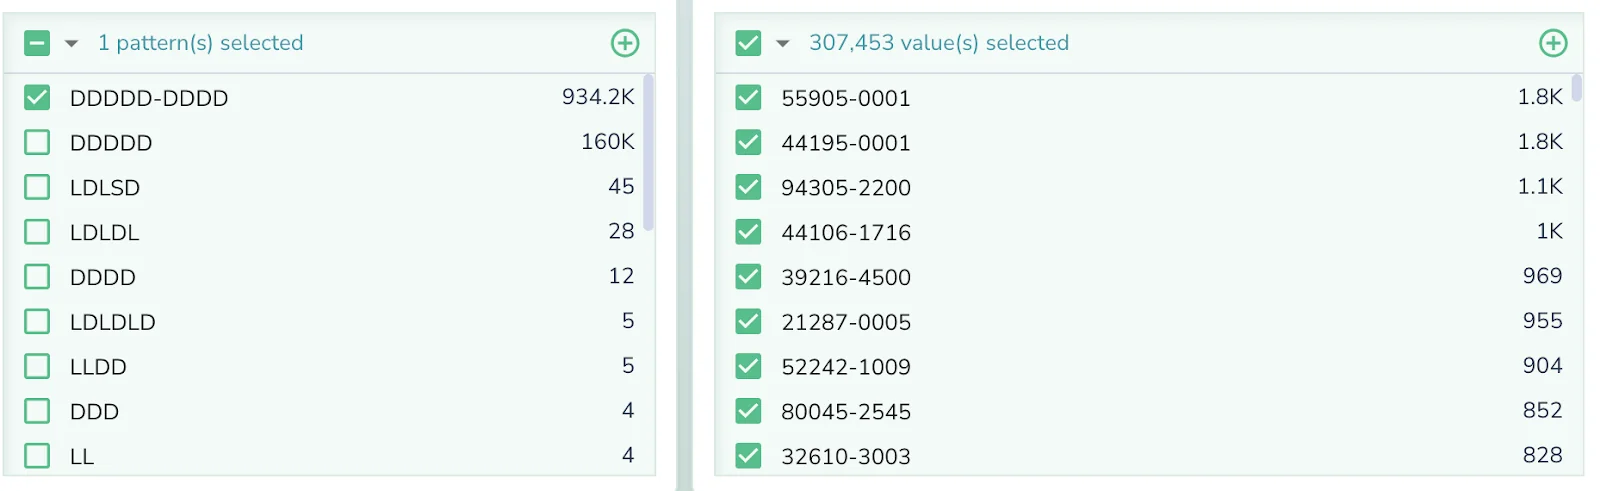
Users can analyze the data and examine how the values are distributed and their patterns, which can help them understand more about their data. Below is an example that illustrates how a lightweight DQ tool simplifies data analysis by categorizing values according to their patterns and quickly identifying the most frequent value.
Here’s another example demonstrating how the Lightweight DQ tool can identify and present significant deviations in the data’s value and pattern, potentially indicating quality concerns.
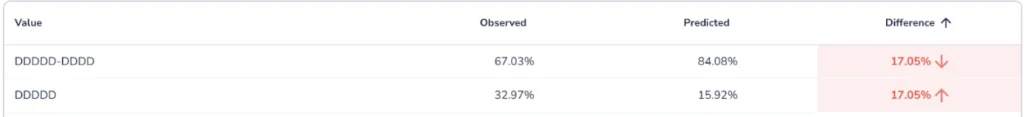
Detecting Value Drifts Using Lightweight Data Quality Tools.
Integrations
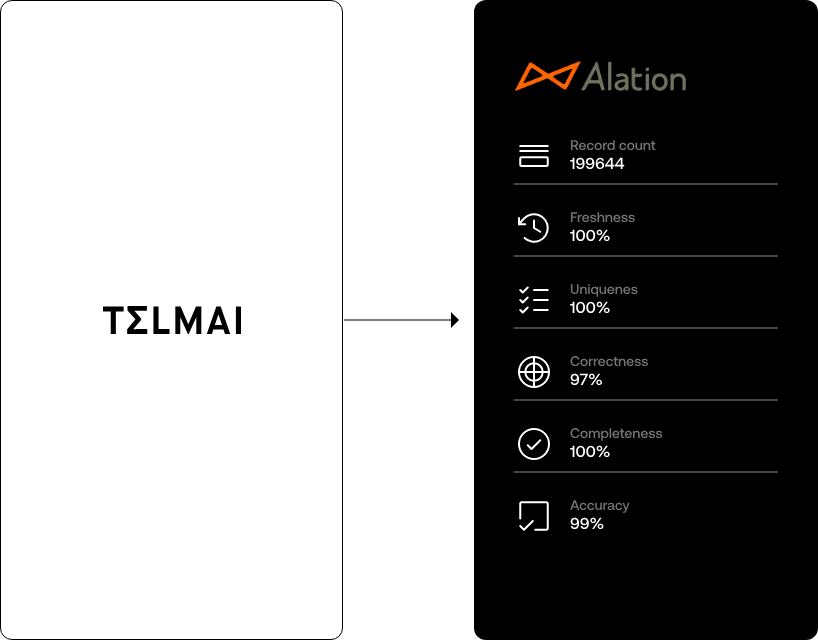
The ability of a DQ tool to integrate with other systems is critical. With out-of-the-box integrations with data catalog tools such as Databricks Unity Catalog and Alation, DQ tools can enrich data catalogs with valuable health insights, open alerts, and essential DQ KPIs, offering a 360-degree view of data quality. This comprehensive perspective paves the way for superior data integrity. Furthermore, REST API support extends these integrations to any catalog system, reinforcing the tool’s adaptability. Such seamless connectivity elevates data governance and empowers swift, targeted actions to uplift data quality across the entire data ecosystem.
Conclusion
Lightweight DQ tools are essential for agile data management, ensuring data accuracy and reliability with minimal overhead. Among the various offerings, Telmai stands out by providing real-time, continuous data monitoring with the capability to detect anomalies and format inconsistencies while ensuring data remains fresh.
Telmai’s edge lies in its user-friendly interface and the deployment of AI-driven analytics. It utilizes advanced machine learning algorithms to foresee and proactively address potential data quality issues. Its intuitive dashboard allows users to visualize data health, trace lineage, and understand quality metrics.
Discover how Telmai can revolutionize your data ecosystem, making it more dynamic and value-driven. Request a demo of Telmai today.
Passionate about data quality? Get expert insights and guides delivered straight to your inbox – click here to subscribe to our newsletter now.
- On this page
See what’s possible with Telmai
Request a demo to see the full power of Telmai’s data observability tool for yourself.


