How to find anomalies in data using ML
Unexpected patterns in your data could reveal a break in your data pipeline or valuable business insights. Either way, you’ll want to know about them. These anomaly detection techniques will keep you informed.


Anomalies represent a disruption to the normal course of events, a break from the predictable and the expected. Anomalies could indicate problems with the data pipeline, data collection process, or they can reveal valuable insights about change in the underlying business or process. For example, an anomaly in customer purchasing behavior may reveal a new trend.
There are multiple techniques for finding anomalies within a dataset. This blog post will cover statistical methods, machine learning techniques, and rule-based approaches. You’ll also discover why companies with modern data stacks use powerful data observability tools like Telmai to provide an effective early warning of potential issues.
Statistical methods
The simplest way to detect anomalies is to use statistical properties of the data such as mean, standard deviation, and quantiles to identify unusual data points. For example, data points that fall outside of a certain number of standard deviations from the mean are considered outliers.
In this method, no training and no test set are necessary. Statistical modeling is mostly about finding relationships between variables and the significance of those relationships, as opposed to making predictions about future behavior.
Rule-based methods
Rules-based methods are useful in identifying clear and well-defined anomalies. They may not be effective at identifying more complex or subtle anomalies or unknown issues and outliers. They are ultimately limited by the knowledge of the data engineer who is setting them up.
Common rules-based methods include threshold-based and business rule-based.
In a threshold-based approach you set thresholds for specific variables or parameters and flag any data points that exceed those thresholds as anomalies. For example, a retailer might set a threshold for the number of returns per customer and flag any customers who exceed that threshold as anomalies, or flag if the overall number of transactions falls more than 30% compared to average over the past month.
In business rule-based method domain experts indicate what is considered normal behavior. For example, a credit union might have a rule that limits the number of ATM withdrawals outside a certain geographic radius that a customer can make in a day and flag any transactions that exceed that limit as anomalies.
Machine learning techniques
The key advantage of using machine learning techniques for anomaly detection is their ability to process large amounts of data quickly and accurately, allowing you to gain valuable insights into the data that might otherwise go unnoticed. There are several approaches that can be used:
Unsupervised learning
In this approach, machine learning algorithms are used to detect patterns and outliers in the data without being given any specific examples of what constitutes an anomaly. Clustering algorithms such as K-means, DBSCAN, or hierarchical clustering can be used to group similar data points together and anomalies are identified as data points that do not belong to any cluster. These algorithms are not practical for large scale data. Other algorithms such as Autoencoder, Isolation Forest, Local Outlier Factor can also be used to find anomalies in a dataset.
Supervised learning
By training classification algorithms on a dataset that includes examples of both normal and anomalous data, the algorithm learns to recognize the characteristics of normal data and can identify data points that deviate significantly from those characteristics as anomalies. Common supervised learning algorithms for anomaly detection include decision trees, random forests, and support vector machines.
Deep learning
Deep learning techniques and neural networks, can used to learn complex patterns and relationships within the data, but they require a large amount of training and labeled data (supervised learning) which makes them not practical for anomaly detection.
How to find anomalies with Telmai without coding or training your data
Finding anomalies in data is not a one-time process, rather it’s an ongoing process that requires continuous monitoring, updating, and maintenance to ensure that the data remains accurate, complete, and consistent over time.
Telmai uses a combination of supervised and unsupervised learning, and statistical methods to learn from your data, measure, and score its quality.
In Telmai, you can detect two distinct kinds of anomalies. They require different approaches.
- Anomalous records/values within a dataset
- Anomalies in data metric trends
The former one focuses on anomalous, inaccurate, or invalid values within a snapshot of data at a point in time.
The later type requires taking into account historical trends of particular data metrics, like number of records, mean value, percent of nulls/empty etc. and apply various methods to determine if observed data metric is anomalous.
We will explain each below:
Detecting anomalous records/values within a dataset
To detect anomalous records and values within a dataset, Telmai does not require prior knowledge of the data, its semantics, or a historical baseline for training before it detects data quality issues.
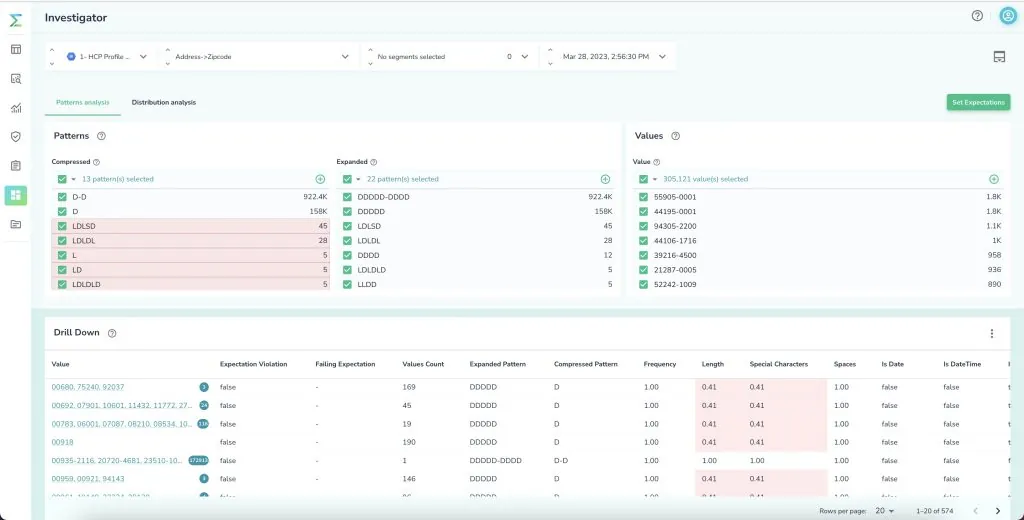
As soon as you connect to your data Telmai analyzes all the values of each attribute (e.g. zip code) and uses statistical methods to determine what formats and patterns are anomalous. For example, if a 3-letter value shows up in the zip code attribute where the majority of the data is 5 digits, Telmai determines that as an anomalous value, helping you accelerate the time to detection of your data quality issues.
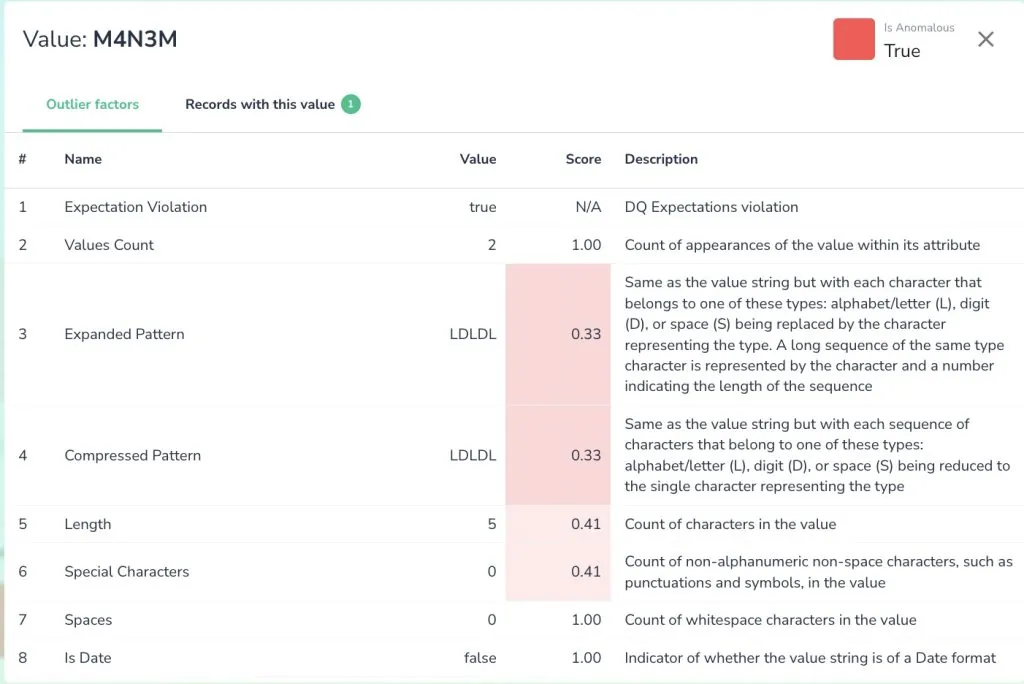
You can combine this unsupervised learning with your input and reinforce what the system has discovered. For example, when a 3-digit zip code is identified as an unaccepted value, you can reinforce that within the UI and Telmai will adapt to that next time it analyzes your data quality score.
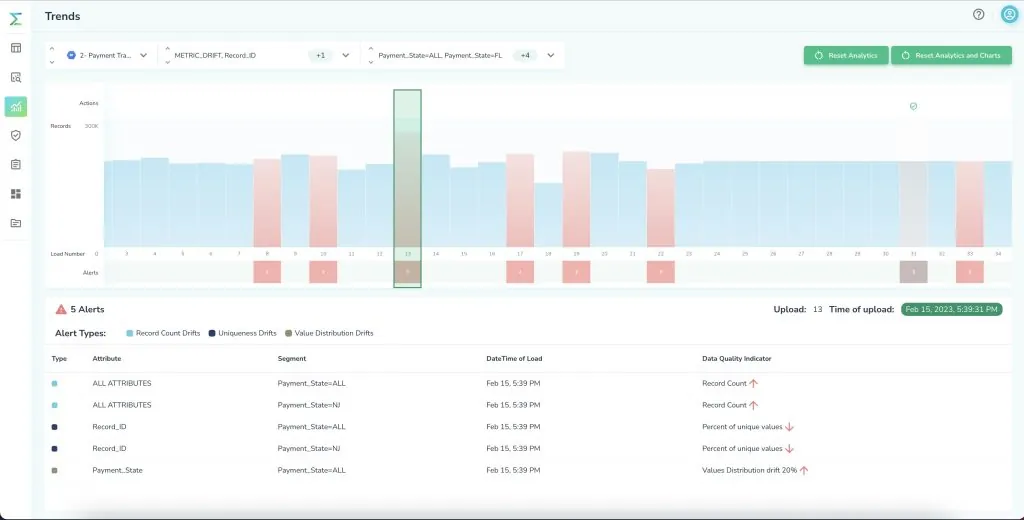
Detecting anomalies in data metrics using time series
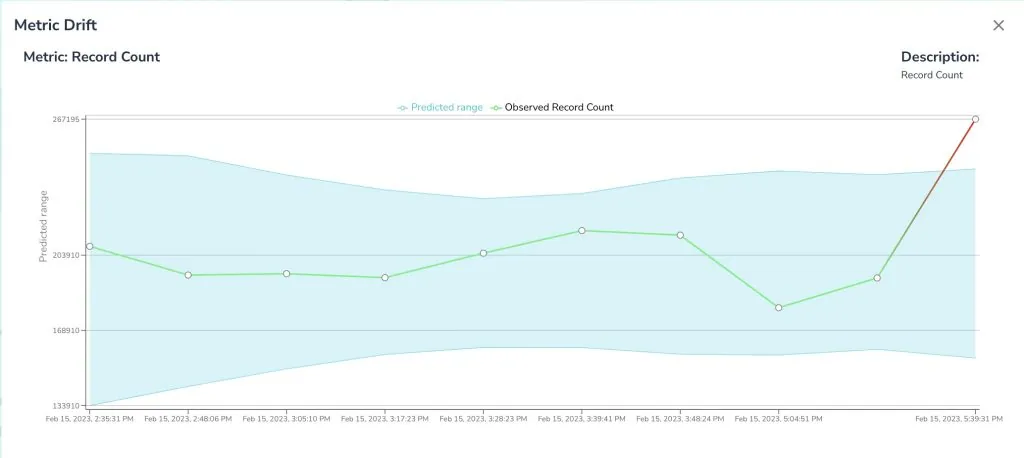
To detect anomalies in data metric trends, Telmai uses time-series analysis to inform you about drifts in your data over time. These drifts include schema drifts, correctness, freshness, completeness, value distribution drifts, and a lot more. You can set up alerts and notifications to get informed about any drifts in your data, or you can rely on Telmai’s predictions about the future values in your data.
Through time-series analysis, Telmai is able to predict a threshold for future expected value. For example, by observing a historical completeness at around 80%-90% range, Telmai predicts a range of future values to help you set the right remediation in place before any downstream impact. Notice that Telmai provides this out of the box; you do not need a data science team to prepare training data that is representative of normal and edge scenarios, train a data model over time, or measure the performance of the model against real world scenarios, and much more.
Telmai is natively designed to automatically find anomalies in data on the first load. As time goes on, when your data crosses a certain threshold or falls outside historical patterns, alerts and notifications help you uncover changes in your data and key data quality KPIs.
Passionate about data quality? Get expert insights and guides delivered straight to your inbox – click here to subscribe to our newsletter now.
- On this page
See what’s possible with Telmai
Request a demo to see the full power of Telmai’s data observability tool for yourself.