How to build a data monitoring system
While the allure of a custom-built solution is undeniable, the myriad of expected features such as robust scalability, a convenient interface, and integrations with all your data pipelines can be difficult to achieve even with a mature engineering team. Learn what it takes and discover why Telmai may be the better choice.

As organizations become more data-driven, decision-makers increasingly use analytical and predictive systems to aid them in understanding their data. However, to ensure trust in these systems, a data quality strategy and set of standards should be in place. Many organizations use data monitoring systems to ensure their data meets a set of predefined standards and also to detect new data anomalies and outliers.
Building a data monitoring system from the ground up can be very challenging, and significant effort and resources are needed to design, develop, and maintain such a system. In this article, you’ll learn about the implications of creating a data monitoring system and the various aspects that should be considered in this process.
1. Use the right data metrics
A data metric is a standard of measurement to assess the data that’s being monitored. Metrics are typically defined relative to a standard value, which could be the best possible scenario (or the worst case). These metrics must be selected carefully and be appropriate for your particular use case. For data quality, they include completeness, uniqueness, freshness, validity, accuracy, and consistency.
The common metric known as the anomaly score is a good example of how you can set your metrics. The anomaly score can be in a range from 0 to 100, where the closer to 100 the value is, the more anomalous the data being monitored is, and the more likely that an error is occurring.
2. Set appropriate thresholds for data metrics
After selecting the right metrics for your use case, your data managers should receive updates about the state of the system to help monitor it effectively and efficiently. One way to go about this is through thresholds and setting up notifications that let data managers know when data falls out of expected ranges.
For instance, if a metric is set to validate a discount code but the transactions fall outside the discounted range, the data managers would then be notified to take appropriate steps to handle the situation. In addition to predetermined and expected behavior in data, thresholds can also be created in response to certain trends and seasonal variations. For instance, if your system’s data volume is known to peak during festive periods, you can build a predictable model to determine future trends and measure your data quality against a predictable threshold
To detect anomalies, you would establish thresholds at which you want alerts to trigger. These thresholds represent the point where the problem is severe enough to require an alert. Multiple thresholds can be set to communicate different degrees of severity and when these thresholds are reached, the appropriate data owner is immediately notified.
Designing thresholds requires proper knowledge of the data, possibly from business stakeholders, profiling the data, or deploying machine learning techniques that learn from the data and its trends to impose the right thresholds at the right time.
Improperly designed thresholds can lead to an overwhelming number of alerts for errors that may not be serious or even need any attention. Inevitably, this would lead to your alerts becoming useless.
3. Integrate with every step of your data pipeline
As you design your data monitoring system make sure you you can integrates it within every step of your data pipeline.
This integration should tie into your data ingest and onboarding, and into every step of your data transformation, data warehouse or data lake systems, as well as any application APIs along the way, or even data streaming queues depending on the nature of your data stack.
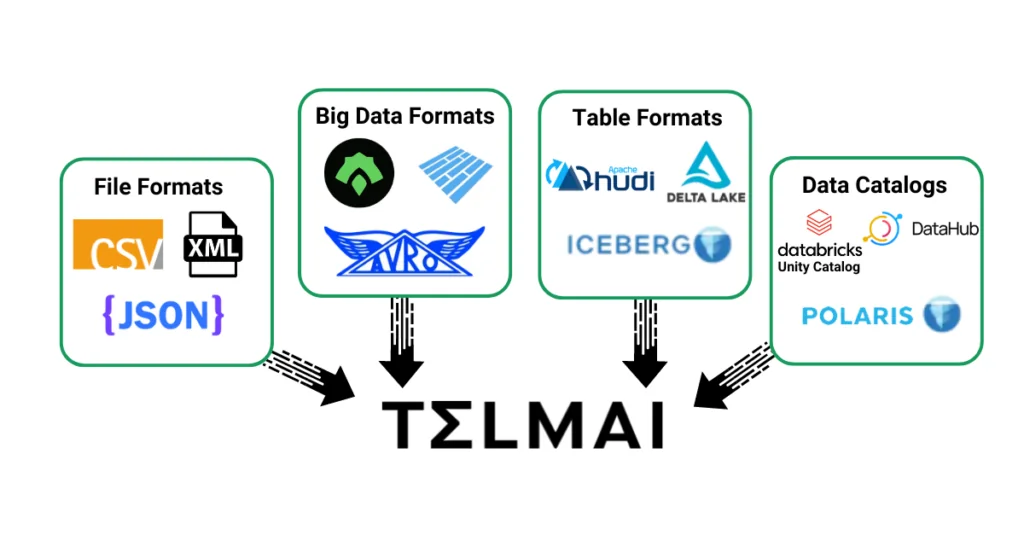
You data monitoring logic should be able to measure the quality of the data from complex and semi-structured sources as easily as it is able to monitor data in warehouses and analytical databases. The sooner and the more upstream your data quality issues are identified, the lower the cost of its implications are downstream. Given that the structure and format of the data varies from system to system, all of this comes at a high cost of engineering work.
Additionally, consider hosting these services on cloud servers or even local servers and implications of building backup, recovery, security, and other infrastructure considerations.
4. Detect issues before they become real problems
After your monitoring system integrates with your data pipeline, computes the data quality metrics, and defines alerting thresholds, your data owners should be able to see alerts within your system or get notified in their preferred channels.
To inform and communicate data quality issues with the broader team of data owners or data consumers you should set up notifications and integrate alerts into daily communication and productivity tools such as Slack, email applications, and so on. This helps you reach desired recipients early and before data quality issues cause severe downstream implications.
5. Create an interactive dashboard
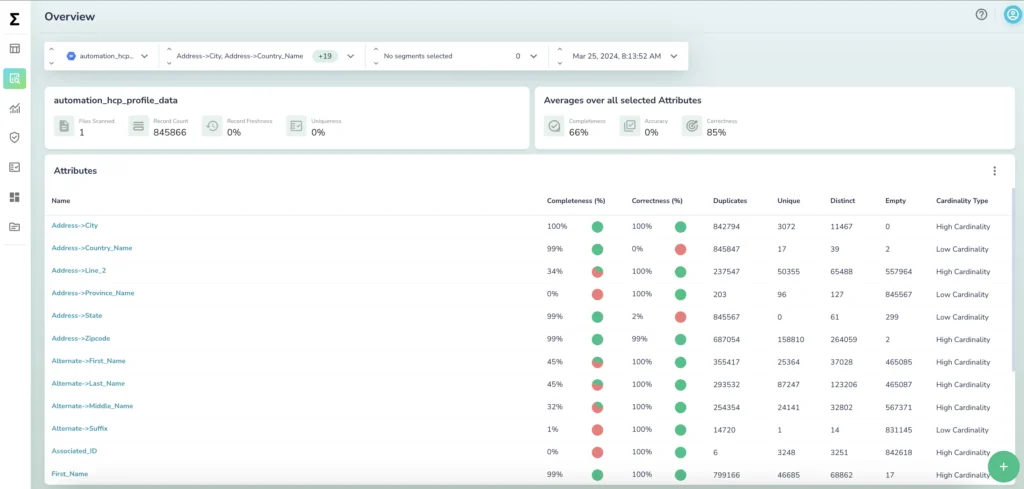
Having a central dashboard for the data monitoring and alerting system is crucial for ease of use and daily tracking, analyzing, investigating, and remediating data quality issues. Without it, you’d have to code to retrieve raw data points that measure the various metrics within your system.
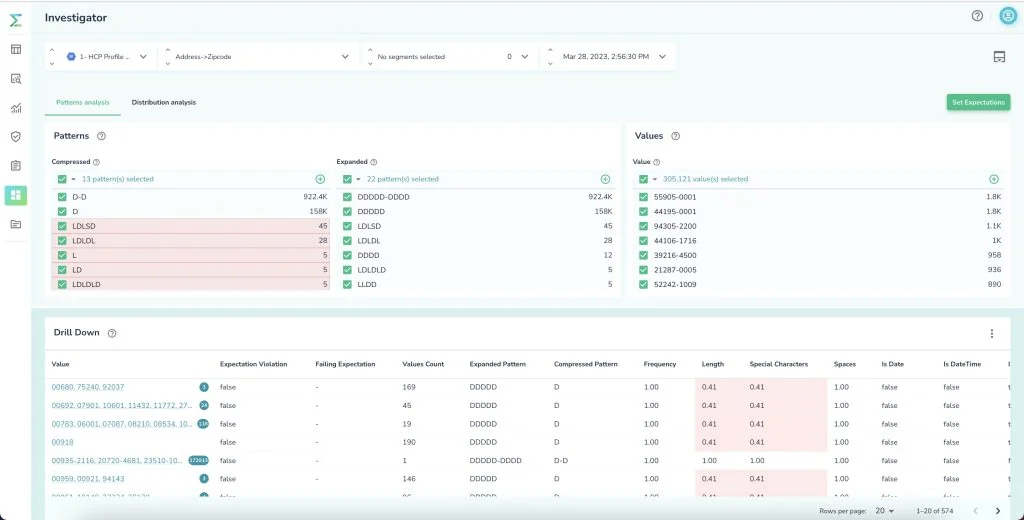
For example, you would have to query a zip code field to see the number of rows that match a specific pattern vs. another. With hundreds of tables and thousands of fields in question this can easily become unmanageable, and without visualizations and interactive investigations, this data is not easily understandable, particularly when the system has been running for a long time.
Interactive visualizations help communicate important points succinctly and in an intuative way. For example, drilling into an anomaly in the data can narrow it down to the specific data points that are contributing to this particular anomaly. Additionally, with dashboards all recorded metrics can be out into time series to provide a one-stop overview of the state of a system through time, with the ability to drill down into the details and route causes behind the scene.
6. Make it scalable
As should be the case with every system, data monitoring systems need to be scalable. With the growth of any organization, its volumes of data typically increase. To monitor this increasing volume over time and to analyze its historical trends, the data monitoring system should be equipped to scale without an impact on performance.
If a monitoring system is not scalable, it could easily run out of compute power with an unprecedented increase or a complex calculation. This halt in the system could be costly for the organization.
As you design, develop, and deploy your monitoring system, scalability must always be in the foreground of your mind to ensure continuous and consistent operation when the system is live.
Are you sure you want to build a data monitoring system from scratch?
The build-out of your data monitoring system is the first cost to consider. Even greater, though, is the cost of more engineers for maintenance and management.

Let Telmai do the heavy lifting involved in both, with a no-code interface you can use to set up data monitoring in your pipeline and integrate with your data regardless of their structure or format.
- Telmai comes out of the box with 40+ different metrics, along with machine learning and intelligent algorithms to detect previously unknown data quality issues.
- Telmai provides an intuitive and interactive visual interface for monitoring your data, and it also integrates with common communication channels such as Slack or email.
- Telmai’s architecture is Spark-based, so it scales as your data grows.
Passionate about data quality? Get expert insights and guides delivered straight to your inbox – click here to subscribe to our newsletter now.
- On this page
See what’s possible with Telmai
Request a demo to see the full power of Telmai’s data observability tool for yourself.