Data observability in batch and realtime
A recent study reveals that 67% of decision-makers in global data and analytics technology are embracing real-time analytics, driven by the inadequacy of traditional data processing methods to meet modern complexities. As businesses actively transition to real-time operations, leveraging up-to-the-millisecond data, they are experiencing transformative benefits.
Introduction
A recent study showed that 67% of global data and analytics technology decisions makers are implementing, have implemented, or are expanding their use of real-time analytics. Data streaming, the back-bone for real-time analytics, is a concept being adopted widely due to the limitations of traditional data processing methods that aren’t able to keep up with the complexity of today’s modern requirements. As most of these obsolete systems only process data as groups of transactions collected over periods of time, organizations are actively seeking to go real-time, acting on up-to-the-millisecond data. This continuous data offers numerous advantages that are transforming the way businesses run.
In this blog, we’ll talk about different ways of processing data, data architectures and where data observability fits in the big picture.
Let’s start with some fundamental definitions.
(Near)Real-time data processing provides near-instantaneous outputs. The processing is done as soon as the data is produced or ingested into the system, so data streams can be processed, stored, analyzed, and acted upon as data is generated in near real-time.
A good streaming architecture including pub-sub forms the foundation of this approach.
In contrast, a batch data processing system collects data over a set period of time and then processes the data in bulk, which also means output is received at a much later time. The data could be processed, stored, or analyzed after collection.
Data consumption use-cases
Let’s lead this with the “Why” or the use-cases to narrow if data needs to be consumed in batch or real-time.
If you are considering real-time, ensure that the “Why” truly requires a real-time system. End users and customers often think they need the information “right away”, but does that mean sub-second, or does it mean they need the data to refresh every 15 minutes, or even on a daily basis. Taking the time to understand the reasons can make a big difference in your approach, architecture and infrastructure (resource) planning.
Batch use cases
Despite the surge in real-time, batch processing will continue to hold space in the organization. There will always be a need for periodic reports by business teams that need a holistic and complete historic view of the data. Just a few such sample scenarios:
- Financial sectors run some batch processes for bi-weekly or monthly billing cycles.
- Payroll systems run bi-weekly or monthly, and batch processes are commonly used to routinely execute backend services
- Order processing tools use batch processing to automate order fulfillment in a timely operation and better customer experience.
- Reporting tools are a classic batch processing use case to derive statistics and analytics on data over a period of time.
- Timely integration across systems: synchronizing data across multiple disparate systems at regular intervals
- Automation and simulation of systems, processes, validations can be automated using batch processes
Real time use cases
Analyzing past data definitely has a place in the process, however, there are many use cases that require data immediately, especially when it comes to reacting to unexpected events. How soon this data can be made accessible will in turn make a big difference to the bottom line.
For example,
- Leaders can make decisions based on real-time KPIs such as customer transaction data, or operational performance data. Previously, this analysis was reactive and looked back at past performance
- Personalization: companies can now better respond to consumers’ demands to have what they want (and even what they don’t know they want yet) thanks to streaming data
- Identifying and stopping a network security breach based on real-time data availability could completely change risk mitigation
- Predicting consumer behavior and what they want “in the moment”
- Sentiment analysis using social media feeds
- On the trading floor, it’s easy to see how understanding and acting on information in real-time is vital, but streaming data also helps the financial functions of any company by processing transactional information, identify fraudulent actions, and more
- A continuous flow of data helps with predictive maintenance on equipment as well as to better understand consumer demand and improve business and operations.
- Streaming data powers the internet of things makes connected and autonomous vehicles possible and safer, and is crucial in making fleet operations more efficient
- …. And many more
It’s evident from the above use cases that more and more businesses are and will be relying on real-time data, however there are some challenges around adopting this process.
A real-time analytics strategy requires a robust data infrastructure to collect, store, and analyze data as it’s created.
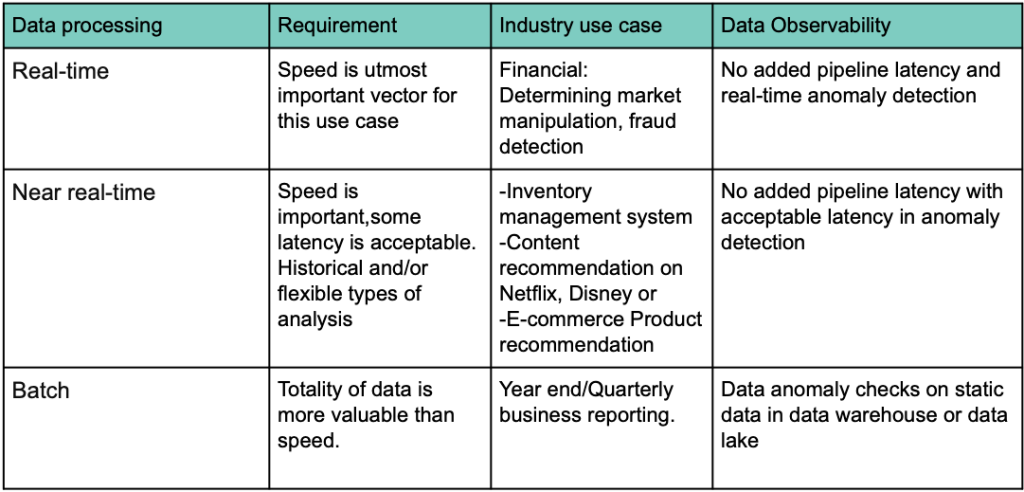
Data observability for batch and real-time consumption
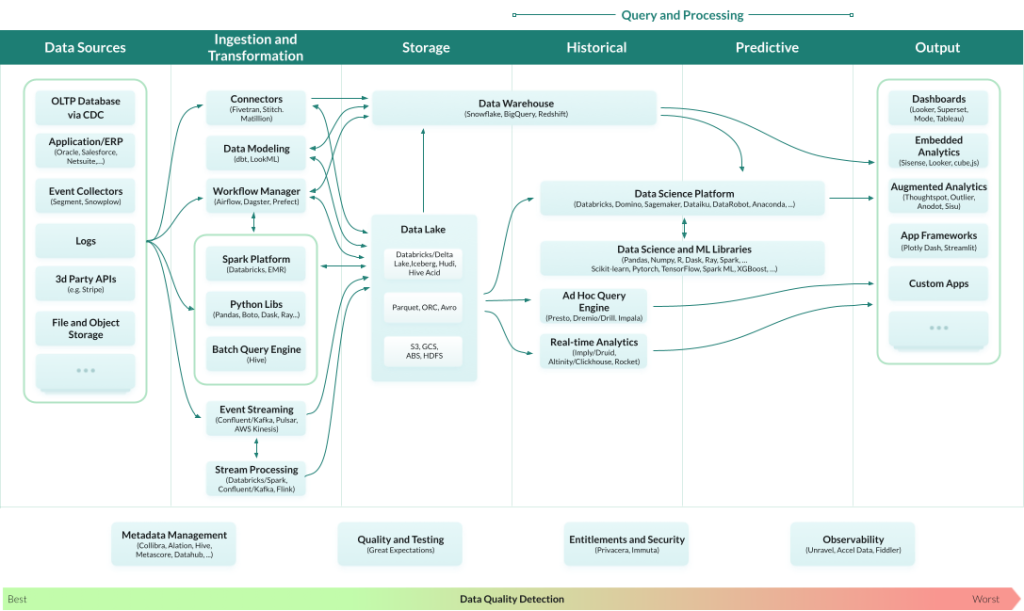
Modified version of image by a16z.com, via blog
Referring to the architecture image in an informative modern data architecture blog, data quality tools haven’t yet carved a prominent place in the entire data ecosystem, but it’s finally starting to gain some traction.
Let’s break down the architecture in the context of how data gets consumed in a batch vs real-time system and give various options of where data observability can fit in the big picture.
As the data sources and data continue to grow in volume, variety and velocity, data monitoring needs to be injected and implemented on continuously streamed data.
Two very important factors play a big role in your data quality ROI
1. Detecting data issues closest to data sources

As shown in the architecture diagram image 1, data quality detection is best done closer to ingestion.The farther bad data travels through the pipeline, the harder the remediation process and higher is the business impact. When data is checked closer to ingestion, the easier it is to triage, and the more reliable it is when consumed for business purposes.
2. Timely quality checks
For any use case of consumption, it’s not just data reliability that matters, but reliable data delivered in a timely manner is crucial. If data checks are conducted after it has been consumed, it’s already too late. If data checks happen very close to consumption, there will continue to be a delay affecting its usage. Time matters just as much as the quality of data.
Keeping the 2 factors in mind, let’s apply Data Observability to the architecture for batch, near-realtime and real-time process.
Data observability for batch processing
For batch use cases, observability or anomaly detection can happen either immediately upon ingestion or perhaps after data aggregation done over time in the Data warehouse.
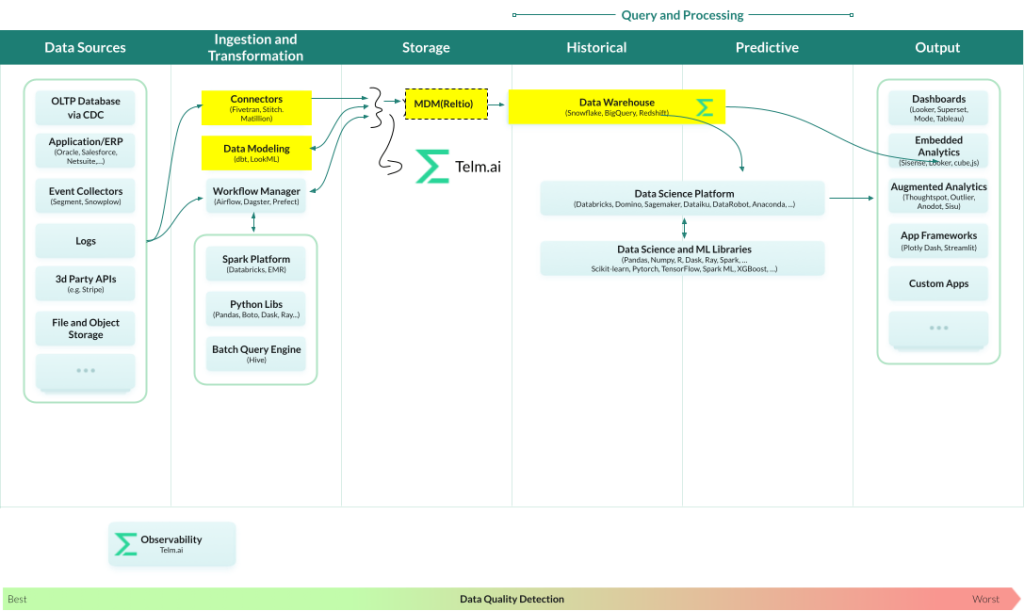
Modified version of image by a16z.com, via blog
If the data is collected only to be read periodically like compensation reports, then finding anomalies and fixing before that periodic reporting is perfectly fine in the Data warehouse. In this case, latency in anomaly detection will not have an impact on your business.
However let’s look at a scenario in which a master data management (MDM) system (ex. Reltio) sits before your Data Warehouse as seen in the architecture diagram below. Let’s assume this MDM system was configured to merge records based on the phone numbers and emails. For example if 2 different sources bring 2 different person records with the same phone number and same email, they will be merged into a single record.
It’s not uncommon to have records with emails like test@test.com and phone numbers like 111-11-1111 (dummy values). An observability platform like telm.ai can detect such values as anomalies because these are over-represented. Though if we detect this much later, after incorrect merging was performed, the damage is already done. In some extreme cases it may result in merging millions of records incorrectly, which may result in extreme costs to repair operation of the entire system. This classic scenario has again and again proven to be a data engineer’s nightmare to triage and troubleshoot.
Data observability in near real-time processing
If the data consumption is near real time, which means it allows for a slight latency, then the order of data quality management and anomaly detection is just as crucial, and needs to happen faster than consumption by the dataOps team rather than the business analysts using that data.
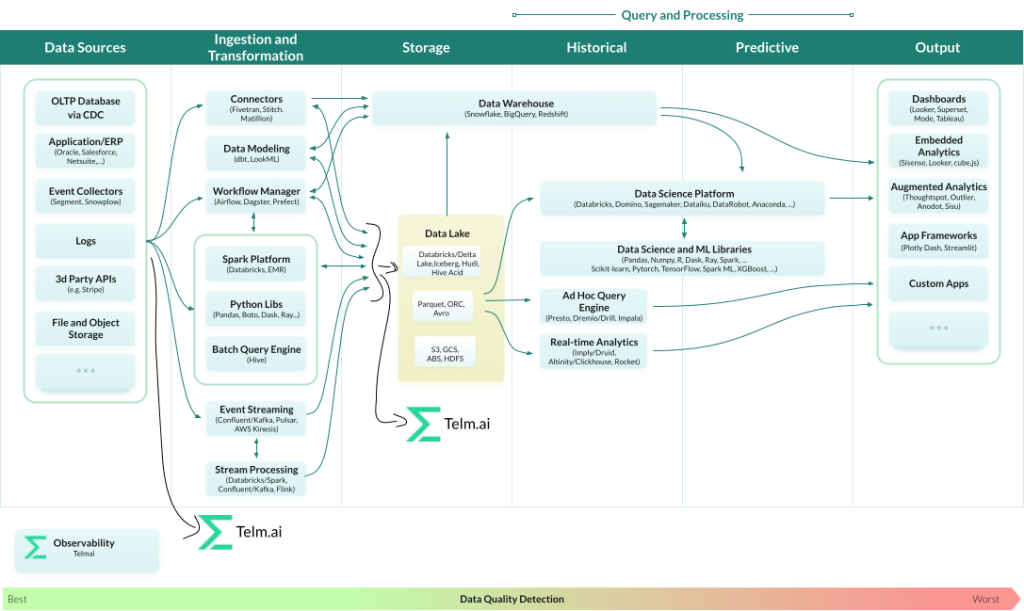
Modified version of image by a16z.com, via blog
Take a simple example of completeness of the zip code attribute that’s critical for your business. If this attribute is used for customer segmentation, the Service Level Objective (SLO) on completeness for this attribute is very high.
Completeness is the most basic and simple problem to detect data issues and is defined as a ratio of records with non empty value for this attribute to a total number of records.
If you’re using streaming to bring data into the system, and one data source brings in partial data with missing zip codes, the data warehouse or data lake is immediately polluted, leading to a great business impact.
However, if your data quality checks are applied at ingestion, your approach to data quality becomes more proactive than reactive. For instance, if you have a goal of 99% completeness in your data warehouse and if a pipeline loads data with missing zip codes, a smart observability platform should notify the data engineers as soon the anomaly is detected, allowing for proactive troubleshooting.
Data observability in real-time processing
There are many examples in modern business where low latency is critical, for instance, the banking and financial services. For these industries, speed (low latency) is directly proportional to profitability. Because time is money, the difference between milliseconds and microseconds can mean the difference between big profits or losses.
Introducing data quality checks at the source levels that can detect issues with very small latency in the pipeline is one of the best ways to tackle absolute real time data consumption needs and anomaly detection. In this approach, the data engineer has the ability to block any bad data/records from being consumed. Data engineers can refine the logic in their pipeline by augmenting data observability outputs with custom logic to make decisions on how to proceed in the pipeline step. Though, in practice, a solution like that may deem to be expensive to implement due to extremely high requirements on performance and reliability.
In most cases, performance of the main pipeline is more critical than absolute data quality and as long as the issues are detected near real-time, it can still provide significant benefits to the business. In this case, a streaming data observability tool like Telm.ai can process data in parallel, report on anomalies, adding a small latency to the data quality checks however, allowing the pipeline step to proceed without any latency. Which is a more acceptable solution for use cases where performance and reliability are both key to the business needs.
Summary and conclusions
It’s clear that real-time data has a significant usage and adoption and it will continue to have a lasting impact on the world at large as more and more data is collected, processed and put to use. Data observability with real-time monitoring is becoming crucial for all these use-cases.
For data observability,
- Real-time use-cases will require a real-time approach to reduce the Mean Time To Detect (MTTD) and Mean Time to Resolve (MTTR) data quality issues
- Data quality algorithms have to continually adapt and improve with the ever changing data
- Even batch benefit heavily from detecting anomalies in real-time.
#dataobservability #dataquality #dataops
Passionate about data quality? Get expert insights and guides delivered straight to your inbox – click here to subscribe to our newsletter now.
- On this page
See what’s possible with Telmai
Request a demo to see the full power of Telmai’s data observability tool for yourself.