4 Steps of the data profiling process
Collect data, analyze it, document your findings, and use what you learn to establish data quality rules and monitor your data quality on an ongoing basis.

Data profiling helps organizations understand their data, identify issues and discrepancies, and improve its quality. Without it, data quality could suffer and impact critical business decisions, customer trust, sales and financial opportunities.
There are four key steps in the data profiling process:
1. Data collection
Start with data collection. Gather data from various sources and extract it into a single location for analysis. If you have multiple sources, choose a centralized data profiling tool (see our recommendation in the conclusion) that can easily connect and analyze all your data without having you do any prep work.
2. Discovery & analysis
Now that you have collected your data for analysis, it’s time to investigate it.
Data profiling falls into three major categories: structure discovery, content discovery, and relationship discovery. While they all help in gaining more understanding of the data, the type of insights they provide are different:
Structure discovery analyzes that data is consistent, formatted correctly, and well structured. For example, if you have a ‘Date’ field, structure discovery helps you see the various patterns of dates (e.g., YYYY-MM-DD or YYYY/DD/MM) so you can standardize your data into one format.
Structure discovery also examines simple and basic statistics in the data, for example, minimum and maximum values, means, medians, and standard deviations.
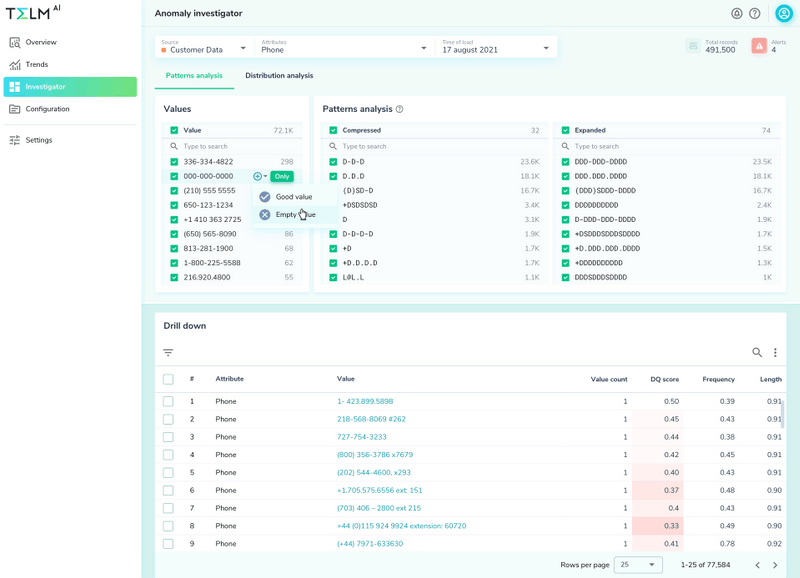
Content discovery looks more closely into the individual attributes and data values to check for data quality issues. This can help you find null values, empty fields, duplicates, incomplete values, outliers, and anomalies.
For example, if you are profiling address information, content discovery helps you see whether your ‘State’ field contains the two-letter abbreviation or the fully spelled out city names, both, or potentially some typos.
Content discovery can also be a way to validate databases with predefined rules. This process helps find ways to improve data quality by identifying instances where the data does not conform to predefined rules. For example, a transaction amount should never be less than $0.
Relationship discovery discovers how different datasets are related to each other. For example, key relationships between database tables, or lookup cells in a spreadsheet. Understanding relationships is most critical in designing a new database schema, a data warehouse, or an ETL flow that requires joining tables and data sets based on those key relationships.
Depending on your use case, you may need structure discovery, content discovery, relationship discovery, or all three. If data content or structure discovery is important for your use case, make sure that you collect and profile your data in its entirety and do not use samples as it will skew your results.
Use visualizations to make your discovery and analysis more understandable. It is much easier to see outliers and anomalies in your data using graphs than in a table format.
3. Documenting the findings
Create a report or documentation outlining the results of the data profiling process, including any issues or discrepancies found.
Use this step to establish data quality rules that you may not have been aware of. For example, a United States ZIP code of 94061 could have accidentally been typed in as 94 061 with a space in the middle. Documenting this issue could help you establish new rules for the next time you profile the data.
4. Data quality monitoring
Now that you know what you have, the next step is to make sure you correct these issues. This may be something that you can correct or something that you need to flag for upstream data owners to fix.
After your data profiling is done and the system goes live, your data quality assurance work is not done – in fact, it’s just getting started.
Data constantly changes. If unchecked, data quality defects will continue to occur, both as a result of system and user behavior changes.
Build a platform that can measure and monitor data quality on an ongoing basis.
Take advantage of data observability tools
Automated tools can help you save time and resources and ensure accuracy in the process.
Unfortunately, traditional data profiling tools offered by legacy ETL and database vendors are complex and require data engineering and technical skills. They also only handle data that is structured and ready for analysis. Semi-structured data sets, nested data formats, blob storage types, or streaming data do not have a place in those solutions.
Today organizations that deal with complex data types or large amounts of data are looking for a newer, more scalable solution.
That’s where a data observability tool like Telmai comes in. Telmai is built to handle the complexity that data profiling projects are faced with today. Some advantages include centralized profiling for all data types, a low-code no-code interface, ML insights, easy integration, and scale and performance.
Passionate about data quality? Get expert insights and guides delivered straight to your inbox – click here to subscribe to our newsletter now.
- On this page
See what’s possible with Telmai
Request a demo to see the full power of Telmai’s data observability tool for yourself.